Thermochemical energy storageVolumetric salt contentHydration kineticsImpregnation methodsSalt loading
Abstract
Thermochemical energy storage (TCES) based on salt hydrates offers high energy density and negligible standby thermal losses, but deployment is often constrained by a fundamental trade-off: increasing volumetric energy storage density can intensify vapour-transport limitations and slow hydration. This study establishes volumetric salt content as a unifying design parameter for CaCl₂-vermiculite composites and quantifies its relationship with hydration kinetics. Atmospheric impregnation and vacuum-assisted impregnation are used deliberately to achieve volumetric salt contents of approximately 0.02 g cm⁻³ to 0.16 g cm⁻³; density measurements, SEM-EDX, and mercury intrusion porosimetry characterize how salt deposition and pore restructuring modify vapour transport pathways. Static sorption tests across two relative-humidity levels (33% and 53%) show that intrinsic hydration kinetics decrease systematically with increasing volumetric salt content and follow a humidity-corrected power-law relationship (coefficient of determination ). Packed-bed experiments confirm that higher volumetric salt content yields higher and more sustained temperature rise under flowing-air conditions. In addition, at 40 wt% solution concentration, vacuum-assisted impregnation produces approximately 2.6 times higher volumetric salt content than atmospheric impregnation and delivers a larger sustained temperature rise. The proposed correlation provides a practical basis for selecting preparation conditions that balance volumetric capacity and power delivery in building applications.
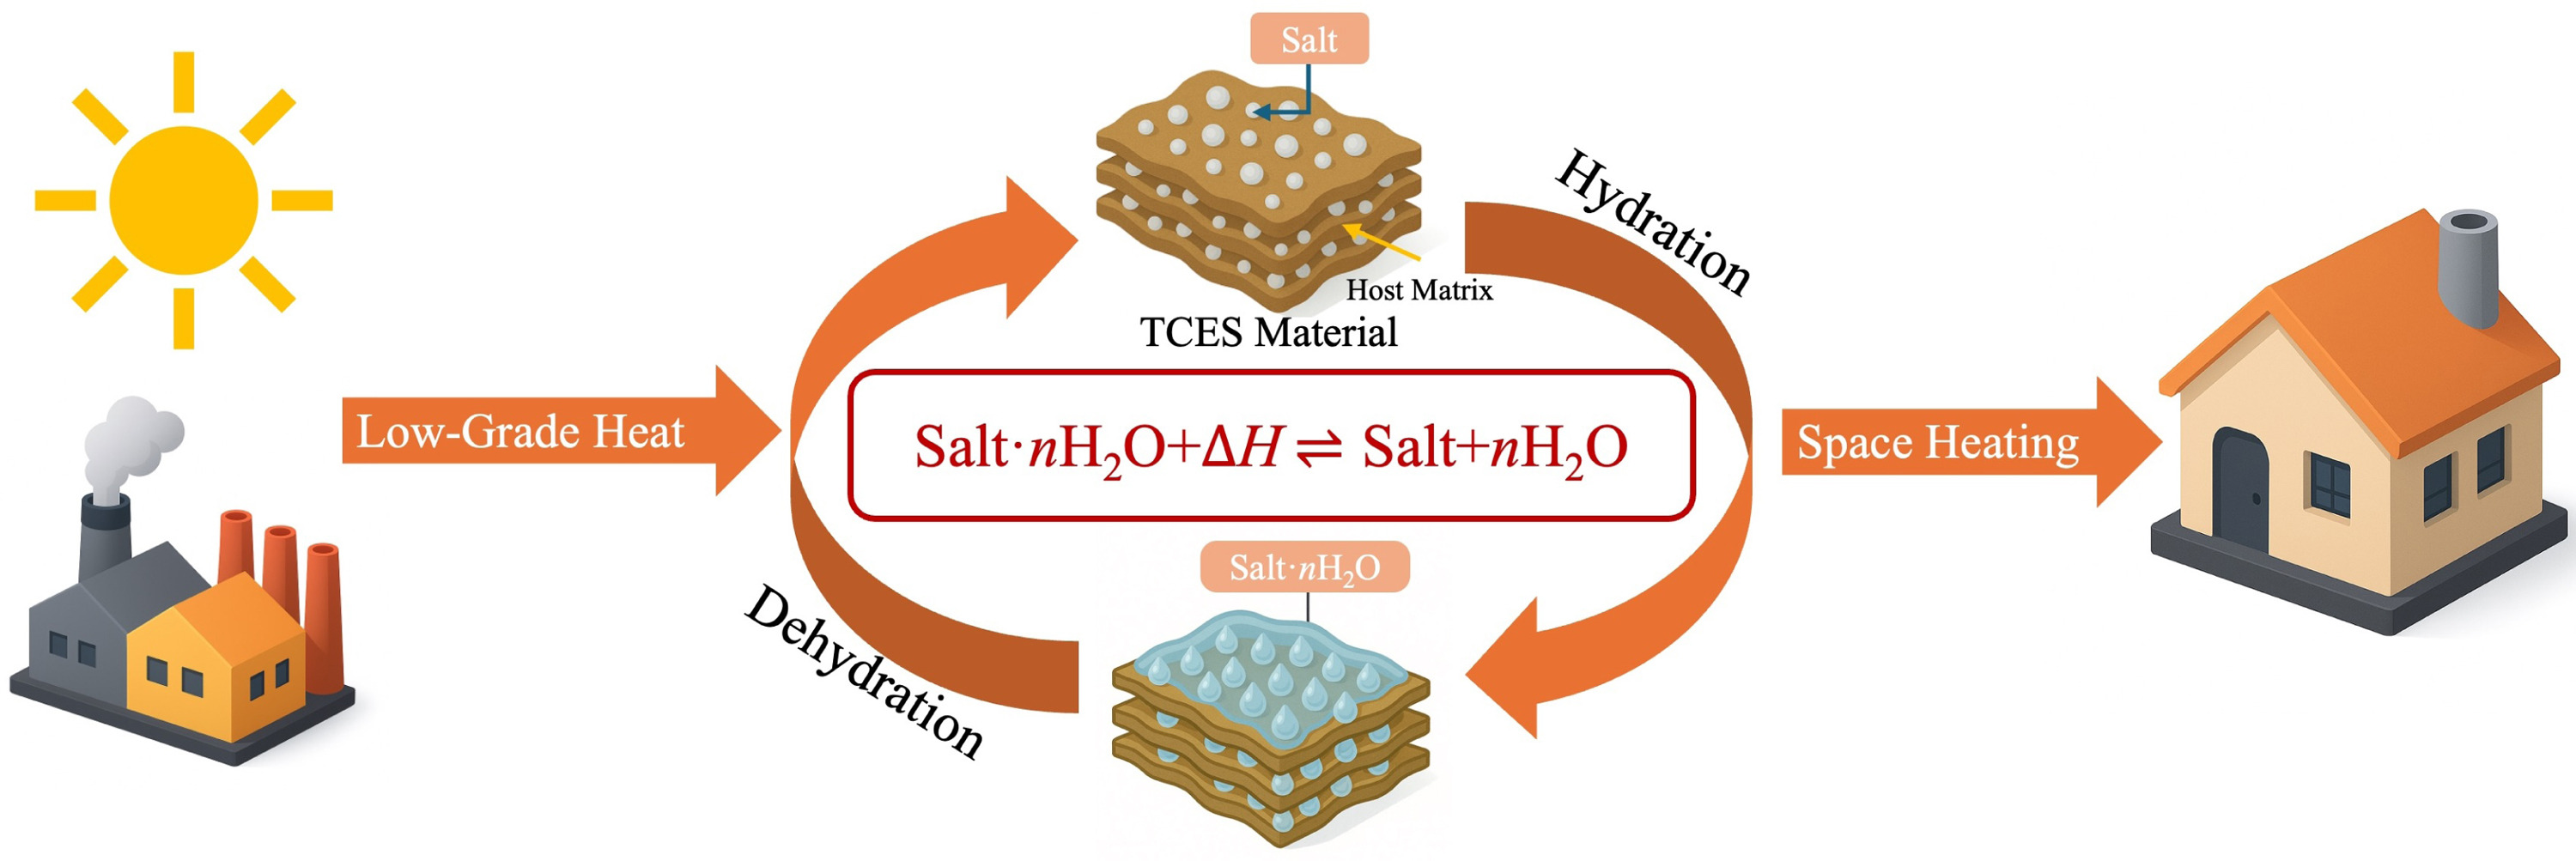
Decarbonizing heat is essential for meeting statutory carbon budgets. In the UK, space and water heating account for roughly 80 % of household energy use and remain predominantly supplied by fossil gas [1]. Although solar thermal energy is abundant, its intermittent nature can lead to a mismatch with heating demand [2]. Industrial waste heat, while more stable, is often misaligned with demand patterns [3]. Thermal energy storage (TES) is key to bridging these gaps, enabling the harvesting and shifting of heat to better match supply with demand [4–6]. Among storage technologies, thermochemical energy storage (TCES) based on reversible salt hydrate reactions is particularly promising due to its high energy density and low regeneration temperature. As energy is stored chemically rather than as sensible heat, standby thermal losses are negligible [7–12]. Fig. 1 schematically illustrates the general operating principle using a TCES material to demonstrate the reversible hydration–dehydration cycle.
The effectiveness of TCES systems depends on the selection and implementation of appropriate salt hydrate materials. Among various salt hydrates, calcium chloride (CaCl₂) is a leading candidate for TCES owing to its high energy density, low cost, and compatibility with low-grade heat sources [13, 14]. Its regeneration temperature is not fixed but depends on water vapour partial pressure: under sufficiently dry conditions, temperatures around 110 °C can achieve complete dehydration, whereas higher water vapour partial pressures require higher regeneration temperatures. However, when used alone, CaCl₂ exhibits operational challenges that limit its practical application [15]. The salt undergoes deliquescence at moderate humidity (approximately 28 % RH at 25 °C) [16], leading to undesirable liquid-phase formation. Repeated thermal cycling leads to progressive particle degradation and agglomeration, significantly lowering the long-term performance of the system [17].
Fig. 1. Schematic illustration of the thermochemical energy storage process based on reversible salt hydration and dehydration.
To address these limitations, embedding the salt within a porous host matrix to form a composite has emerged as a widely adopted strategy [18–20]. This approach uses the host matrix to disperse the salt and enlarge the salt–vapour interface [21]. It also retains any transient brine via capillary forces, thereby confining the hydration–dehydration process to the local pore environment and ensuring repeatable operation [22]. Common host materials include vermiculite [23], silica gel [24], and zeolites [25]. Among these, vermiculite offers low cost, macroporosity, and excellent thermal stability, making it well suited for CaCl₂ composites [26]. Although vermiculite-CaCl₂ systems have been widely studied [27–30], their performance depends critically on the preparation methodology, which determines both salt loading and its spatial distribution within the matrix. These factors jointly set the volumetric energy density and the mass-transfer pathways that govern reaction kinetics, two performance dimensions whose interplay has not been quantitatively characterized.
Prior studies across diverse salt-matrix combinations, summarized in Table 1, reveal consistent preparation trends: vacuum-assisted impregnation outperforms conventional wet methods in salt loading [31, 32], while solution concentration exerts a direct but non-linear effect on final salt content [33]. Critically, maximizing salt content introduces a trade-off: excessive loading reduces porosity and impedes vapour diffusion, thereby slowing reaction kinetics. Despite establishing these preparation principles, existing studies predominantly report gravimetric metrics (e.g., salt loading per unit mass), which offer limited guidance for reactor design where volumetric constraints dominate. The fundamental relationship between volumetric salt content and reaction kinetics, which is essential for balancing storage capacity against power output, remains largely unexplored.
In prior work [29], a combined static-dynamic characterization methodology was validated by comparing different porous host matrices. Building on that foundation, the present study focuses on the vermiculite-CaCl₂ system and introduces volumetric salt content () as a quantitative design parameter linking preparation conditions to intrinsic kinetics, a relationship not established previously.
Table 1. Summary of impregnation strategies for composite thermochemical energy storage materials.
Host matrix
Salt
Methodology and variables
Main findings
Ref.
Vermiculite
CaCl₂
Five methods were compared: single-step, multi-step, vacuum, high-pressure, and high-temperature impregnation.
Salt loading varied from 51.4–81.4 wt%, depending on the preparation method. Multi-step impregnation achieved the highest loading but exhibited poor cycling stability, whereas vacuum-assisted impregnation reached 71.1 wt% while maintaining good stability.
Vacuum-assisted impregnation resulted in 32% higher salt loading compared to the wet method. Performance improved above 60 kPa, with diminishing returns observed at very high concentrations.
Bath saturation with levels ranging from 40% to 100% of the theoretical maximum.
Salt loading ranged from 63.7–77.2 wt%, showing a non-linear relationship with saturation level. Excessive loading reduced porosity and caused solution leakage, indicating trade-offs between capacity and stability.
Effect of solution concentration using four CaCl₂ concentrations: 10, 20, 30, and 42 wt%.
Salt loading increased from 23.8–57.8 wt% with concentration, demonstrating a direct concentration-loading correlation. The rate of increase decreased at higher concentrations, indicating diminishing returns.
Wet versus vacuum-assisted impregnation with solution concentrations of 10, 20, and 35 wt%.
Vacuum-assisted impregnation achieved 30% higher loading (0.11–0.22 vs. 0.07–0.15 g/g). Salt loading increased systematically with concentration for both methods, confirming concentration-loading trends across matrix types.
Optimization of solution concentration using four CaCl₂ concentrations: 10, 20, 30, and 40 wt%.
A 40 wt% concentration caused leakage and performance decay, whereas 30 wt% provided an optimal balance between loading and stability. These results indicate a critical threshold beyond which high loading negatively affects long-term performance.
Accordingly, the study adopts a four-stage experimental programme. First, composites are synthesized by atmospheric and vacuum-assisted impregnation using CaCl₂ solutions of 10–40 wt% to span a broad range of . Second, microstructural, density, and pore-structure analyses quantify how these preparation variables modify internal architecture. Third, static sorption experiments at 33% and 53% RH characterize intrinsic uptake capacity and hydration kinetics. Fourth, dynamic tests in a packed-bed reactor evaluate reactor-scale thermal output. Together, these stages establish as a unifying parameter that links material synthesis to practical thermochemical storage performance.
2 Material synthesis and characterization methods
This section details the experimental methodology employed to synthesize the composite materials, characterize their physical and microstructural properties, and evaluate their performance. The procedures for material preparation, physical parameter measurement, and both static and dynamic sorption testing are described to provide a detailed framework for understanding the relationship between synthesis conditions and material behaviour.
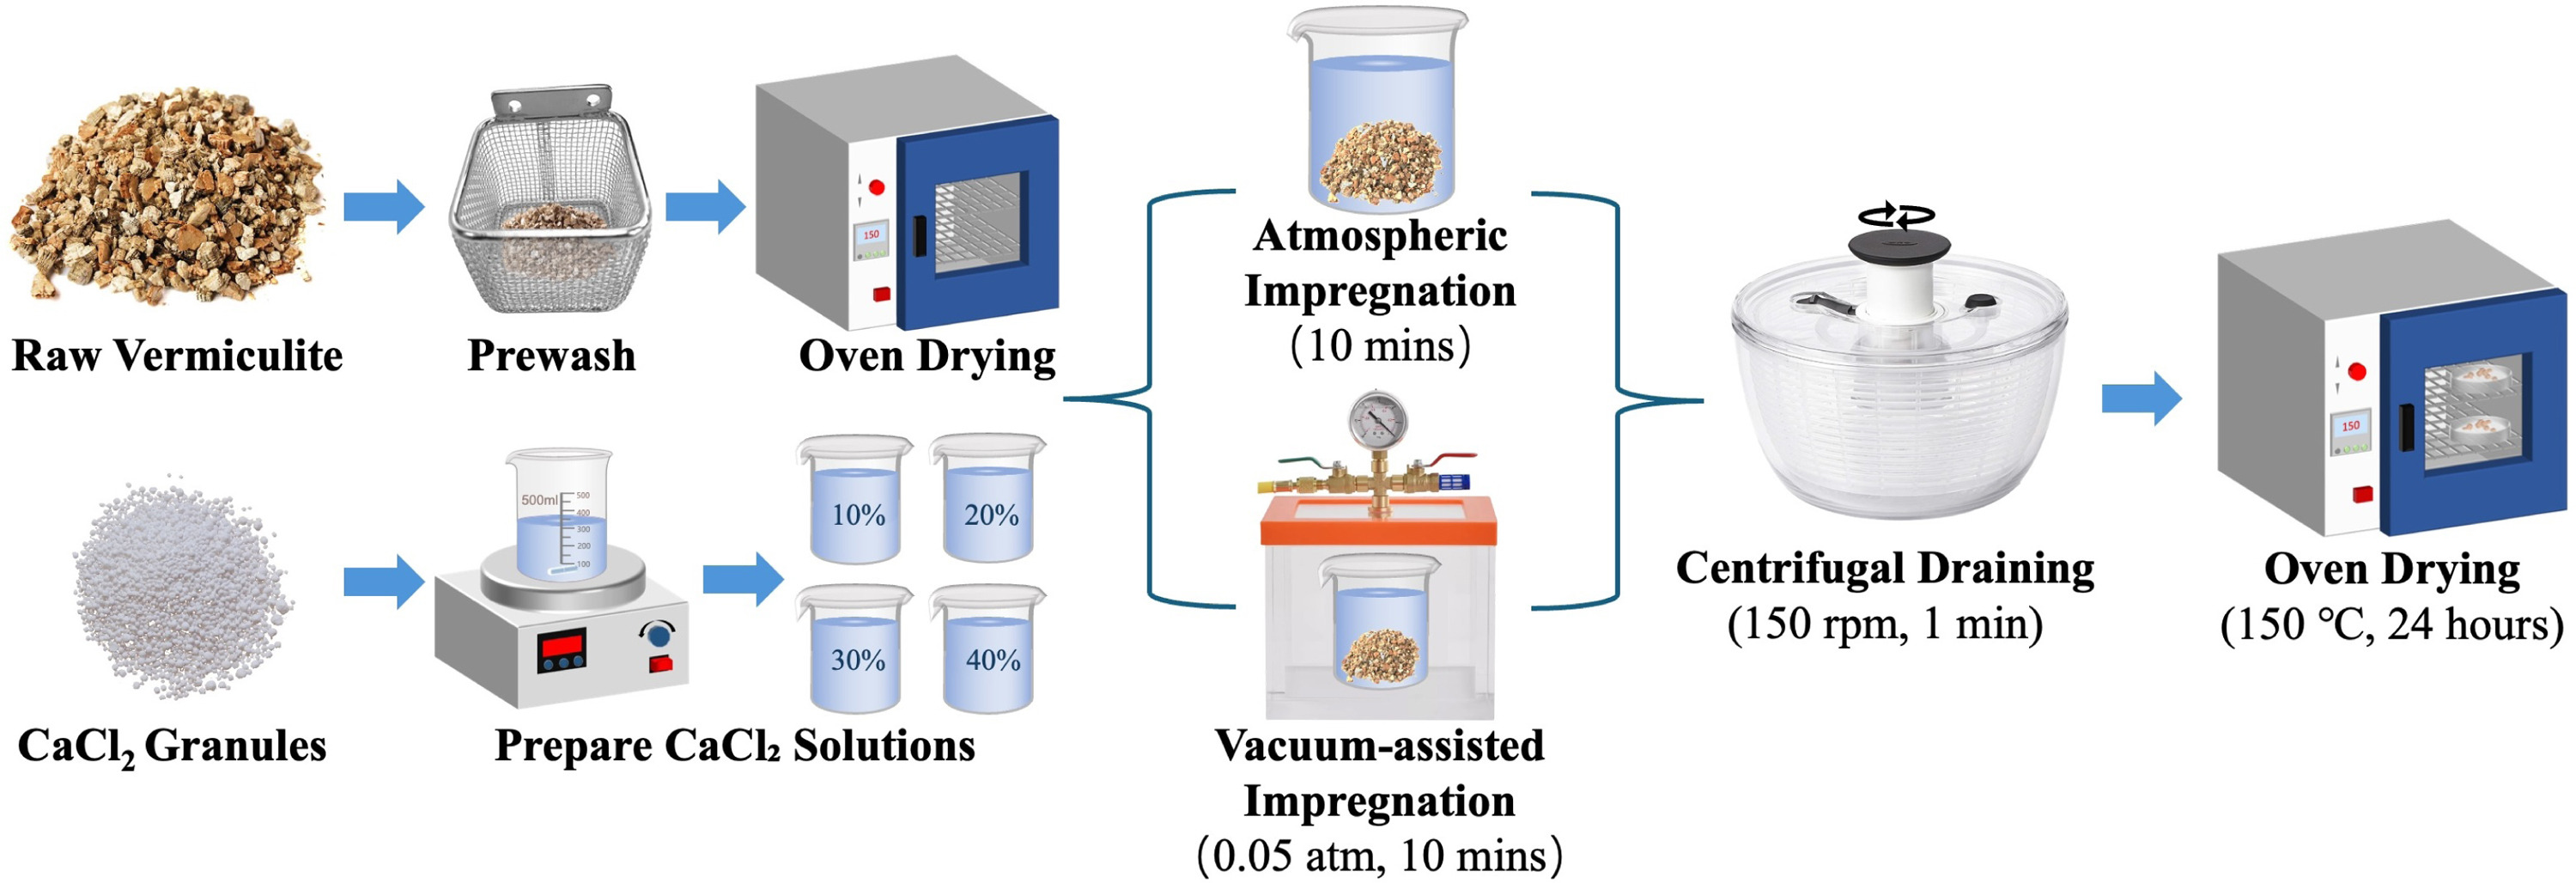
In this study, vermiculite-CaCl₂ composites were prepared using two distinct impregnation methods to systematically evaluate their effects on composite properties: atmospheric impregnation (A) and vacuum-assisted impregnation (Vac). The preparation procedures for the composites are detailed as follows and illustrated in Fig. 2. Both impregnation route and solution concentration were systematically varied to generate a broad range of volumetric salt contents for subsequent microstructural and performance analysis.
Raw vermiculite (particle size 5–8 mm, UKGROW LTD) was first rinsed with deionized water to remove surface impurities and dried at 150 °C for 24 h. For each composite preparation, approximately 160 g of dried vermiculite (equivalent to 1000 cm³ bulk volume) was used. Anhydrous CaCl₂ pellets (purity 99.0%, Sigma-Aldrich) were used to prepare aqueous solutions with mass concentrations of 10, 20, 30, and 40 wt%. The resulting eight composite samples were systematically labelled according to the convention ‘V-xA’ or ‘V-xVac’, where ‘V’ denotes the vermiculite matrix, ‘x’ is the initial solution concentration (10, 20, 30, or 40 wt%), and ‘A’ or ‘Vac’ signifies the impregnation method.
Fig. 2. Schematic illustration of the composite preparation process using atmospheric impregnation (A) and vacuum-assisted impregnation (Vac) methods.
The preparation began by immersing pre-treated vermiculite in the CaCl₂ solution, ensuring complete immersion. For atmospheric impregnation, the vermiculite was fully submerged in the CaCl₂ solution and left at room temperature for 10 min. For vacuum-assisted impregnation (Vac), the beaker containing vermiculite and solution was placed in a vacuum chamber, which was then evacuated to 0.05 atm and maintained for 10 min to enhance solution penetration into the porous matrix structure through pressure differential-driven infiltration.
Following this impregnation step, all samples underwent identical subsequent processing. Excess solution was first removed by centrifugal spinning at 150 rpm for 1 min. The samples were then dried in an oven at 150 °C for 24 h to achieve complete dehydration and salt crystallization. The centrifugation parameters (150 rpm for 1 min) were selected based on preliminary trials to remove free surface liquid while avoiding extraction of solution from within the pore structure.
2.2 Physical parameter characterization
The bulk density () of the composite was measured by determining the volume of a known mass using a graduated cylinder. To quantify the interparticle void fraction () of the packed bed, a fine sand replacement method was employed, based on the same principle as the ASTM D1556 sand-cone test for in-situ soil density [37]. Pre-dried fine sand (particle size 0.15–0.25 mm) with a calibrated bulk density was used to fill the voids between particles. The particle size was selected to exceed the vermiculite pore opening size (μm) to minimize internal penetration. Each void-fraction measurement was repeated five times, and the mean of the three central values (excluding the two extremes) was reported to minimize operator-dependent variability. The void fraction was calculated as:
(1)
where is the interparticle void volume, is the bulk volume of the packed bed, is the mass of sand filling the voids, and is the calibrated bulk density of the fine sand. Particle density () was calculated from the measured bulk density and void fraction:
(2)
Skeletal density () was determined using helium pycnometry (Micromeritics AccuPyc II 1340). Samples were dried at 150 °C for 24 h, crushed to particle sizes smaller than 2 mm, and measured using three purging cycles with high-purity helium gas. Each sample was measured three times consecutively to ensure accuracy. Internal particle porosity () was calculated from particle density and skeletal density:
(3)
To quantify macroscopic structural changes, the average particle thickness was determined by measuring five randomly selected particles from each sample using a vernier caliper. Pore size distribution was characterized using mercury intrusion porosimetry (Micromeritics AutoPore IV), providing detailed information about pore structure evolution upon salt impregnation. Microstructure and elemental distribution were examined using SEM-EDX (JEOL JSM-6490LV) on representative samples (V-10 A, V-10Vac, V-40 A, V-40Vac) to assess salt distribution uniformity and matrix structural changes.
Salt content was quantified by measuring the calcium concentration in composite samples using ICP-OES after drying and grinding. Gravimetric salt content (, %) was defined as the mass percentage of CaCl₂ in the composite. To relate material structure to thermal storage performance, volumetric salt content (, g cm⁻³) was introduced as the primary design parameter, calculated according to:
(4)
2.3 Static sorption experiment
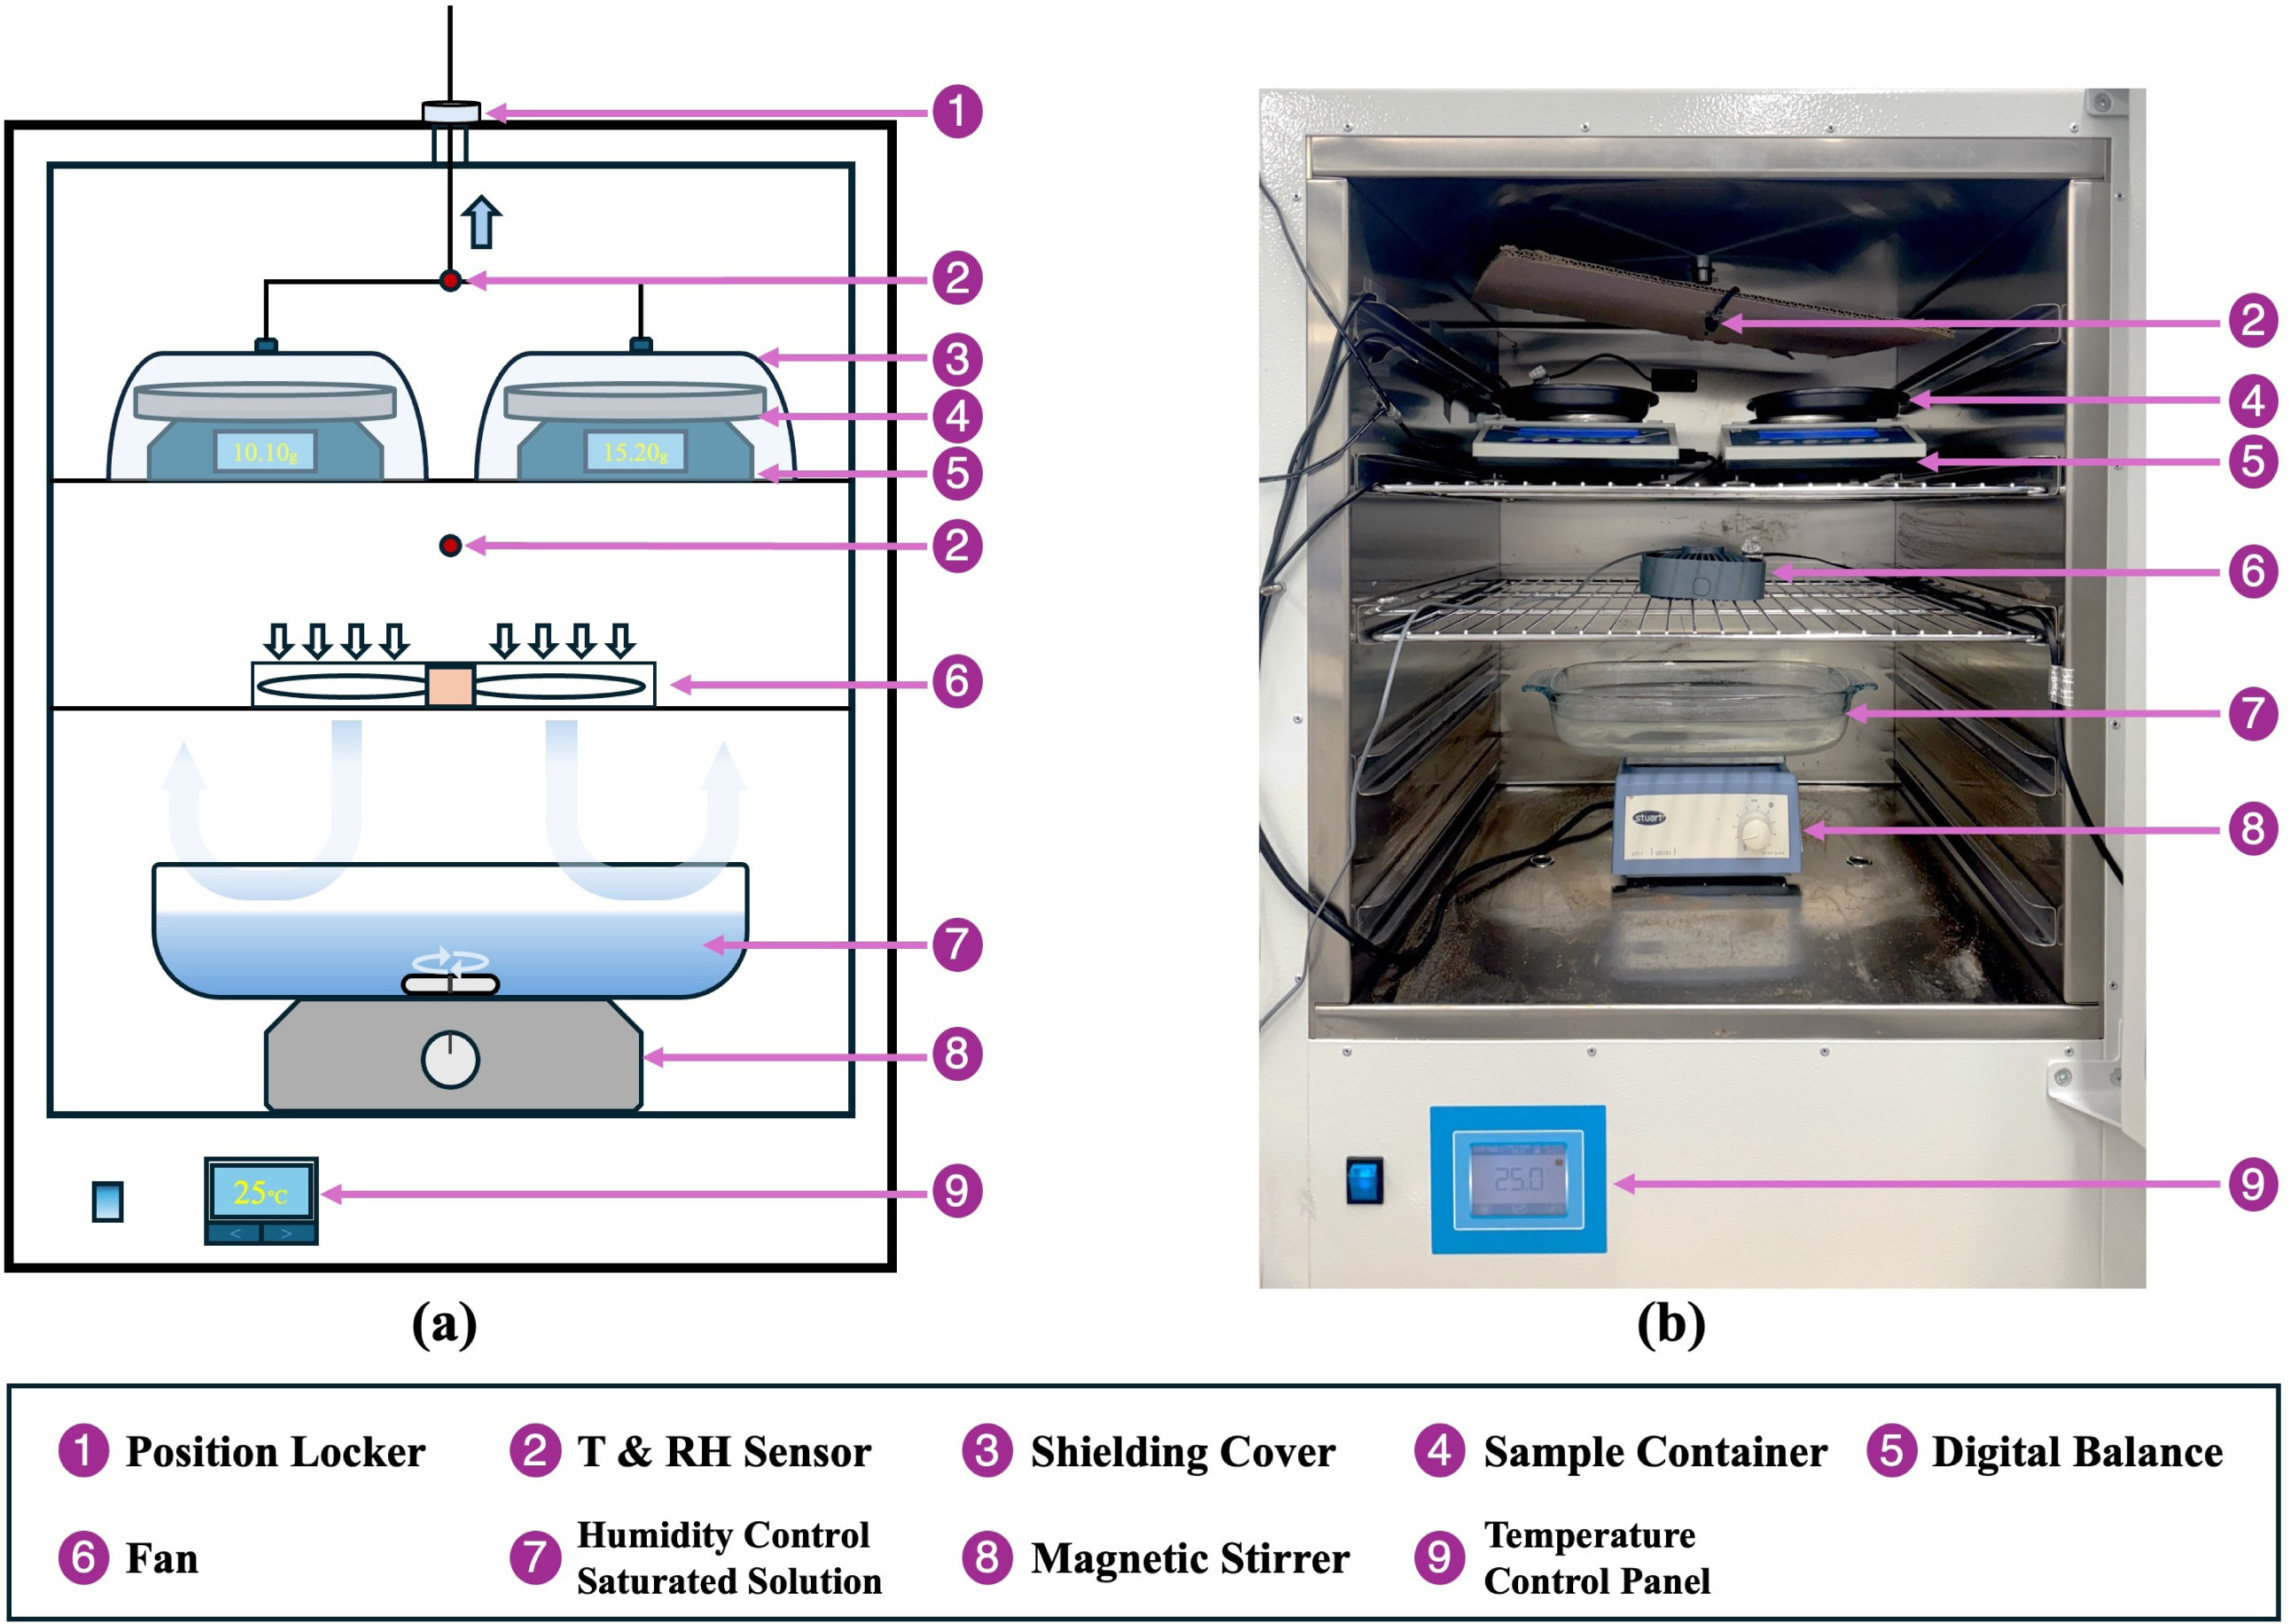
Static sorption tests were conducted using a temperature-controlled chamber (Genlab Multi-Purpose Benchtop Incubator) maintained at 25 °C to evaluate the intrinsic moisture sorption capacity and reaction kinetics under controlled conditions. For each test, approximately 50 ml of composite material was spread as a thin layer with a depth comparable to a single particle diameter to minimize bed-scale transport limitations. Relative humidity levels of 33 % and 53 % were maintained by placing supersaturated salt solutions of magnesium chloride (MgCl₂) and magnesium nitrate (Mg(NO3)2), respectively, inside the chamber to control the vapour pressure. These humidity levels were selected as they lie above the deliquescence relative humidity of CaCl₂ (approximately 28%–30% at 25 °C), bracketing the practical operating range for building-integrated TCES systems without requiring active humidification. Although the selected humidity conditions exceed the deliquescence threshold of CaCl₂, no macroscopic liquid exudation was observed during the static tests over the test duration. This is attributed to capillary confinement of transient brine within the vermiculite pore network. The kinetic correlation was derived under deliquescence-permitted conditions (33%–53% RH at 25 °C) and is not intended for direct extrapolation below the deliquescence threshold without additional validation. A fan beneath the solution surface promoted vapour mixing, while a stainless steel plate positioned between the solution and the sample zone provided thermal shielding. Sample mass was continuously monitored using a high-precision balance (accuracy 0.01 g); readings were streamed to a computer and automatically time-stamped, enabling continuous measurement throughout each test. The experimental setup is illustrated in Fig. 3.
To enable direct comparison between samples of varying densities, the water uptake (w) was defined as the mass of water absorbed per unit bulk volume of the composite material (g cm⁻³). The time-dependent water uptake data, , were fitted to a first-order kinetic model to quantify sorption kinetics:
(5)
whose analytical solution is
(6)
Fig. 3. Static sorption experimental setup: (a) schematic diagram; (b) photograph of the experimental apparatus.
For a unified kinetic comparison, the characteristic time to reach 90% of equilibrium uptake () is used. Substituting into Eq. (6) gives:
(7)
To characterize the hydration behaviour and enable comparison with theoretical hydration capacities, the instantaneous hydration ratio () was calculated, representing the moles of water absorbed per mole of CaCl₂ at time t:
(8)
where and represent the moles of water and CaCl₂, respectively, is the sample mass at time t (g), is the initial dry mass (g), and are the molar masses of water and CaCl₂ (18.01 and 110.98 g/mol, respectively), and is the gravimetric salt content expressed as a mass fraction.
To normalize the reaction progress and enable quantitative comparison of sorption kinetics across different samples, the normalized uptake () was defined as:
(9)
where is the equilibrium hydration ratio. This dimensionless parameter ranges from 0 to 1, providing a universal metric for comparing the degree of approach to equilibrium across samples with varying composition and salt loading.
2.4 Dynamic sorption experiment
Dynamic sorption experiments were conducted to evaluate the macroscopic heat release behaviour and water uptake performance of the porous composites under conditions representative of reactor-scale operation.
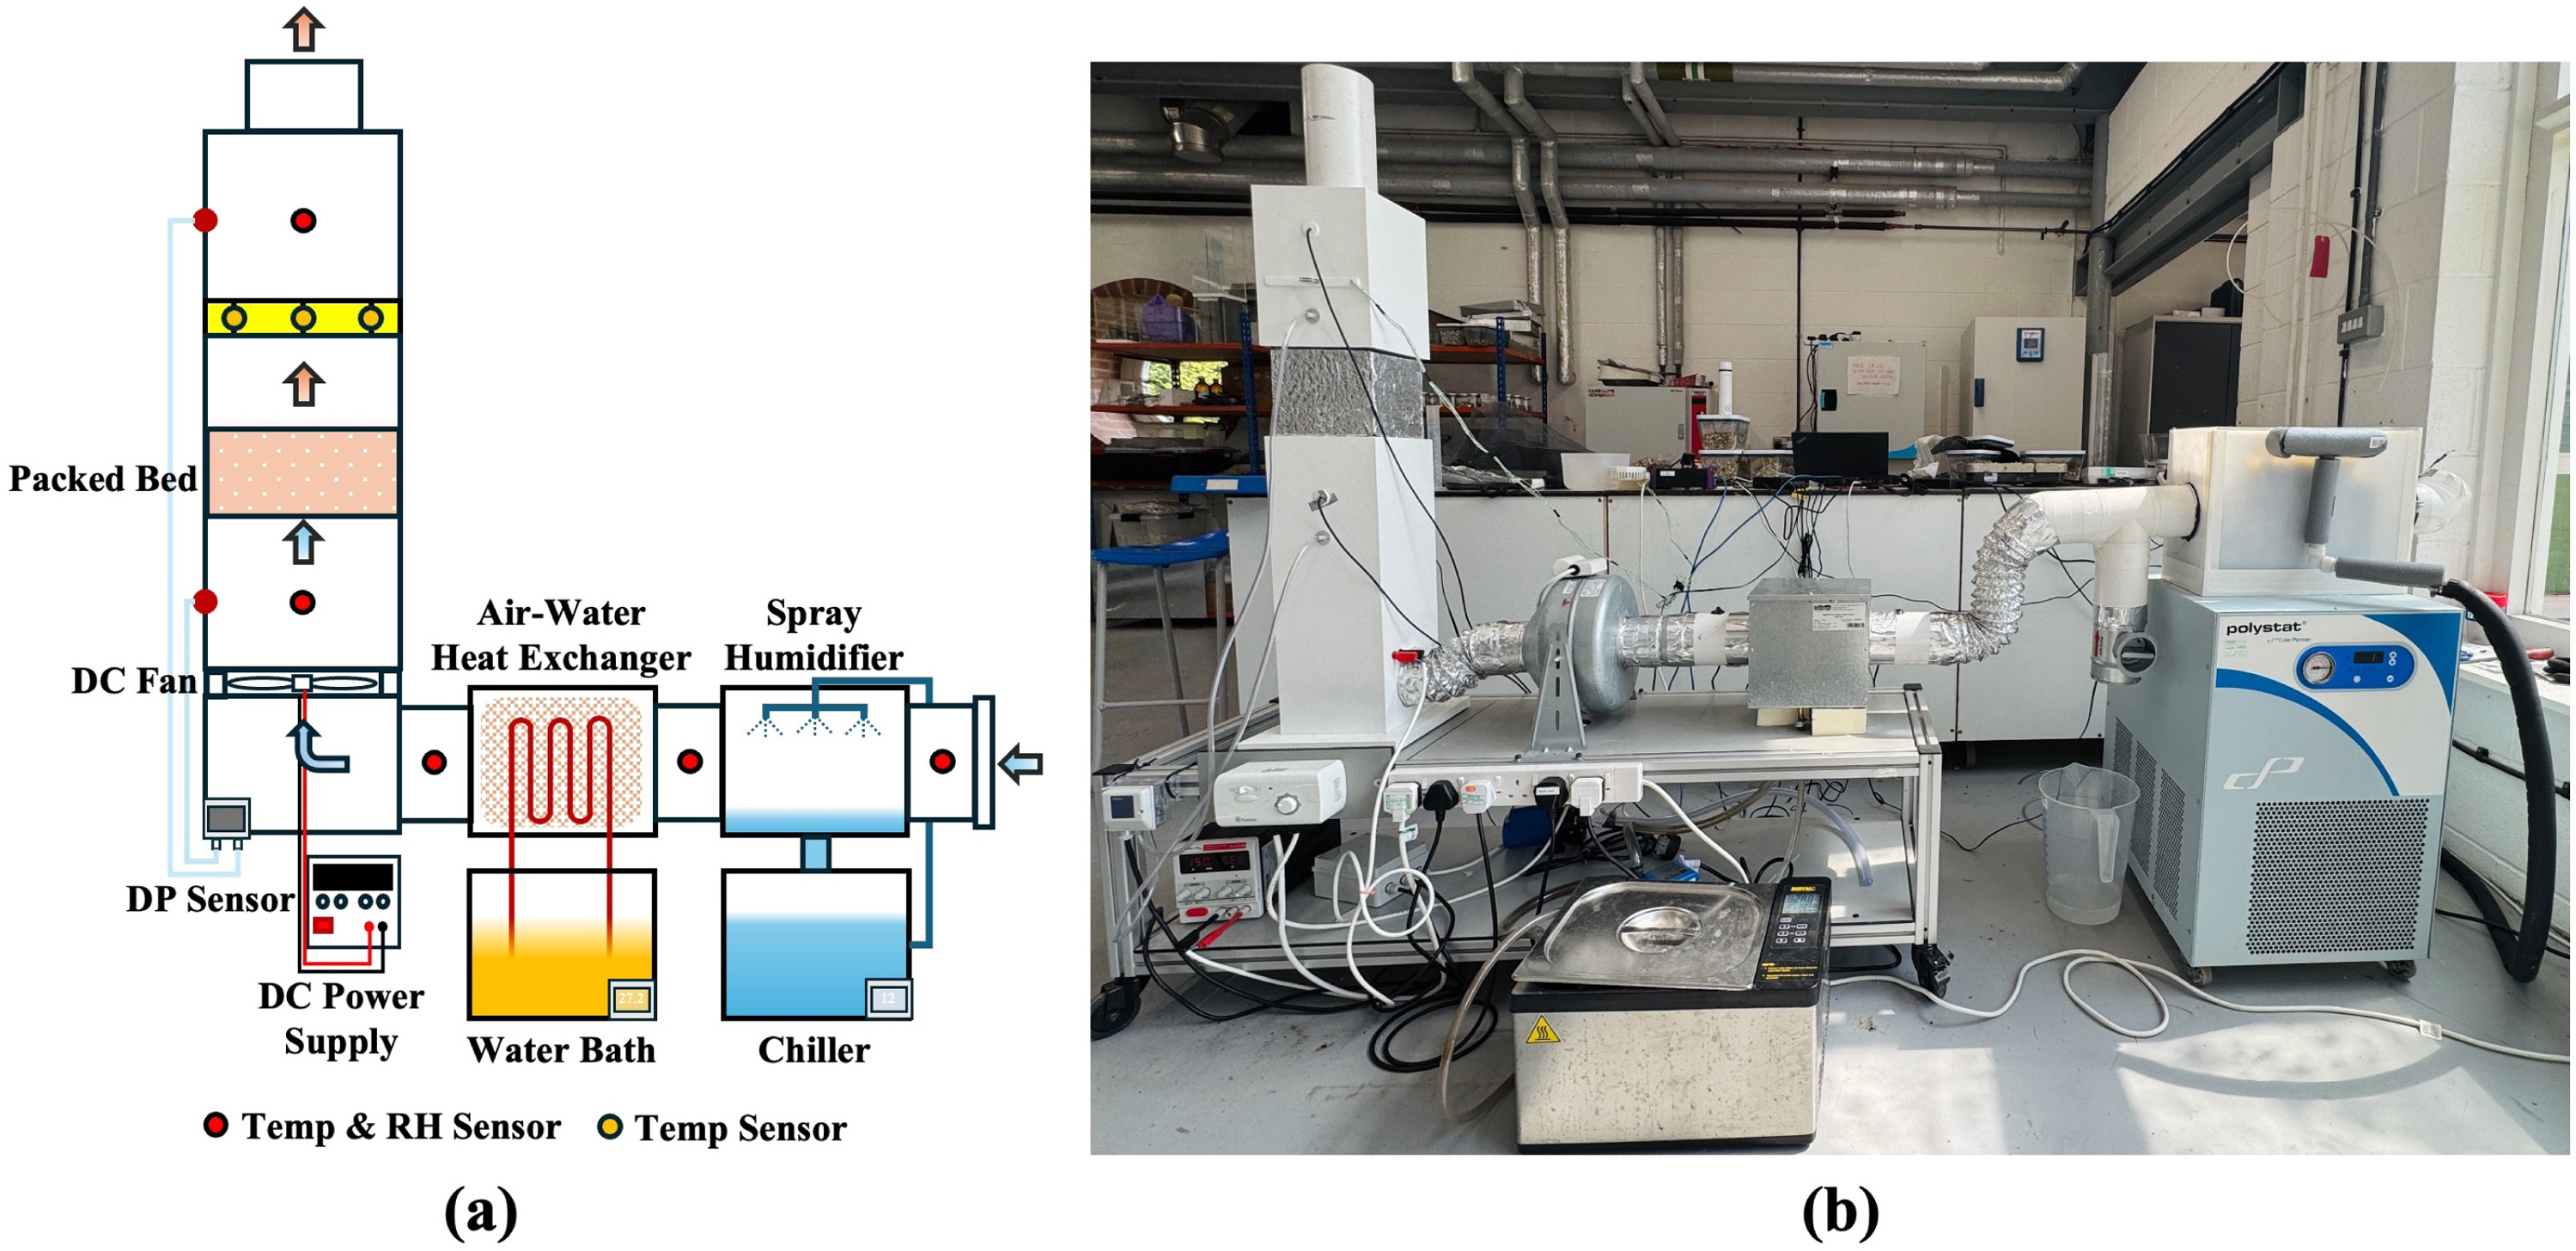
The experimental setup is illustrated in Fig. 4, which shows both a schematic diagram of the system and a photograph of the laboratory apparatus. The reaction bed consisted of a square duct with a cross-section of 15 cm 15 cm, filled to a depth of 4.44 cm with 1000 cm³ of composite material under bulk packing conditions. To achieve precise inlet air conditions, a two-stage method was used. First, a chiller and spray humidifier cooled the air to its dew point for dehumidification. Then, a heat exchanger with hot water from a water bath reheated the air, ensuring a stable final state of °C and % relative humidity. A DC fan maintained a constant velocity of 0.2 m s⁻¹ at the inlet.
Real-time monitoring of operational parameters was enabled by a dedicated instrumentation system, as summarized in Table 2. Temperature and humidity sensors were positioned at the inlet and outlet to track temperature and relative humidity of the main air stream, while a K-type thermocouple array located 20 cm downstream of the bed outlet provided detailed information on outlet temperature uniformity. Air velocity at the outlet and the pressure drop across the packed bed were recorded concurrently. Pressure drop was measured using a low-range differential pressure sensor (0–200 Pa, Siemens QBM2030-5) to ensure sufficient resolution; uncertainty was quantified from steady-state signals recorded at 1 Hz over a 30-min interval, yielding a relative standard deviation of 2%–4% across samples, while the stated instrument accuracy (1 Pa) represented a minor portion of the overall variation.
Fig. 4. Dynamic sorption experimental setup: (a) schematic diagram; (b) photograph of the laboratory apparatus.
Table 2. Instrumentation specifications for the dynamic sorption experimental system.
Parameter
Instrument
Model
Accuracy
Position
Temperature
T&RH Sensor
HOBO UX100-003
0.21 °C
Inlet/Outlet
Relative Humidity
T&RH Sensor
HOBO UX100-003
3.5 %
Inlet/Outlet
Temperature Profile
Thermocouple Array
K-type
0.1 °C
20 cm downstream
Air Velocity
Impeller Anemometer
ATP ET-965
3 %
Reactor outlet
Pressure Drop
Differential Sensor
Siemens QBM2030-5
3 %
Across packed bed
Data Acquisition
Data Logger
DataTaker DT80
1 Hz sampling
Central control
3 Results & discussion
3.1 Effect of preparation method on volumetric salt content and microstructure
3.1.1 Morphological analysis and salt distribution
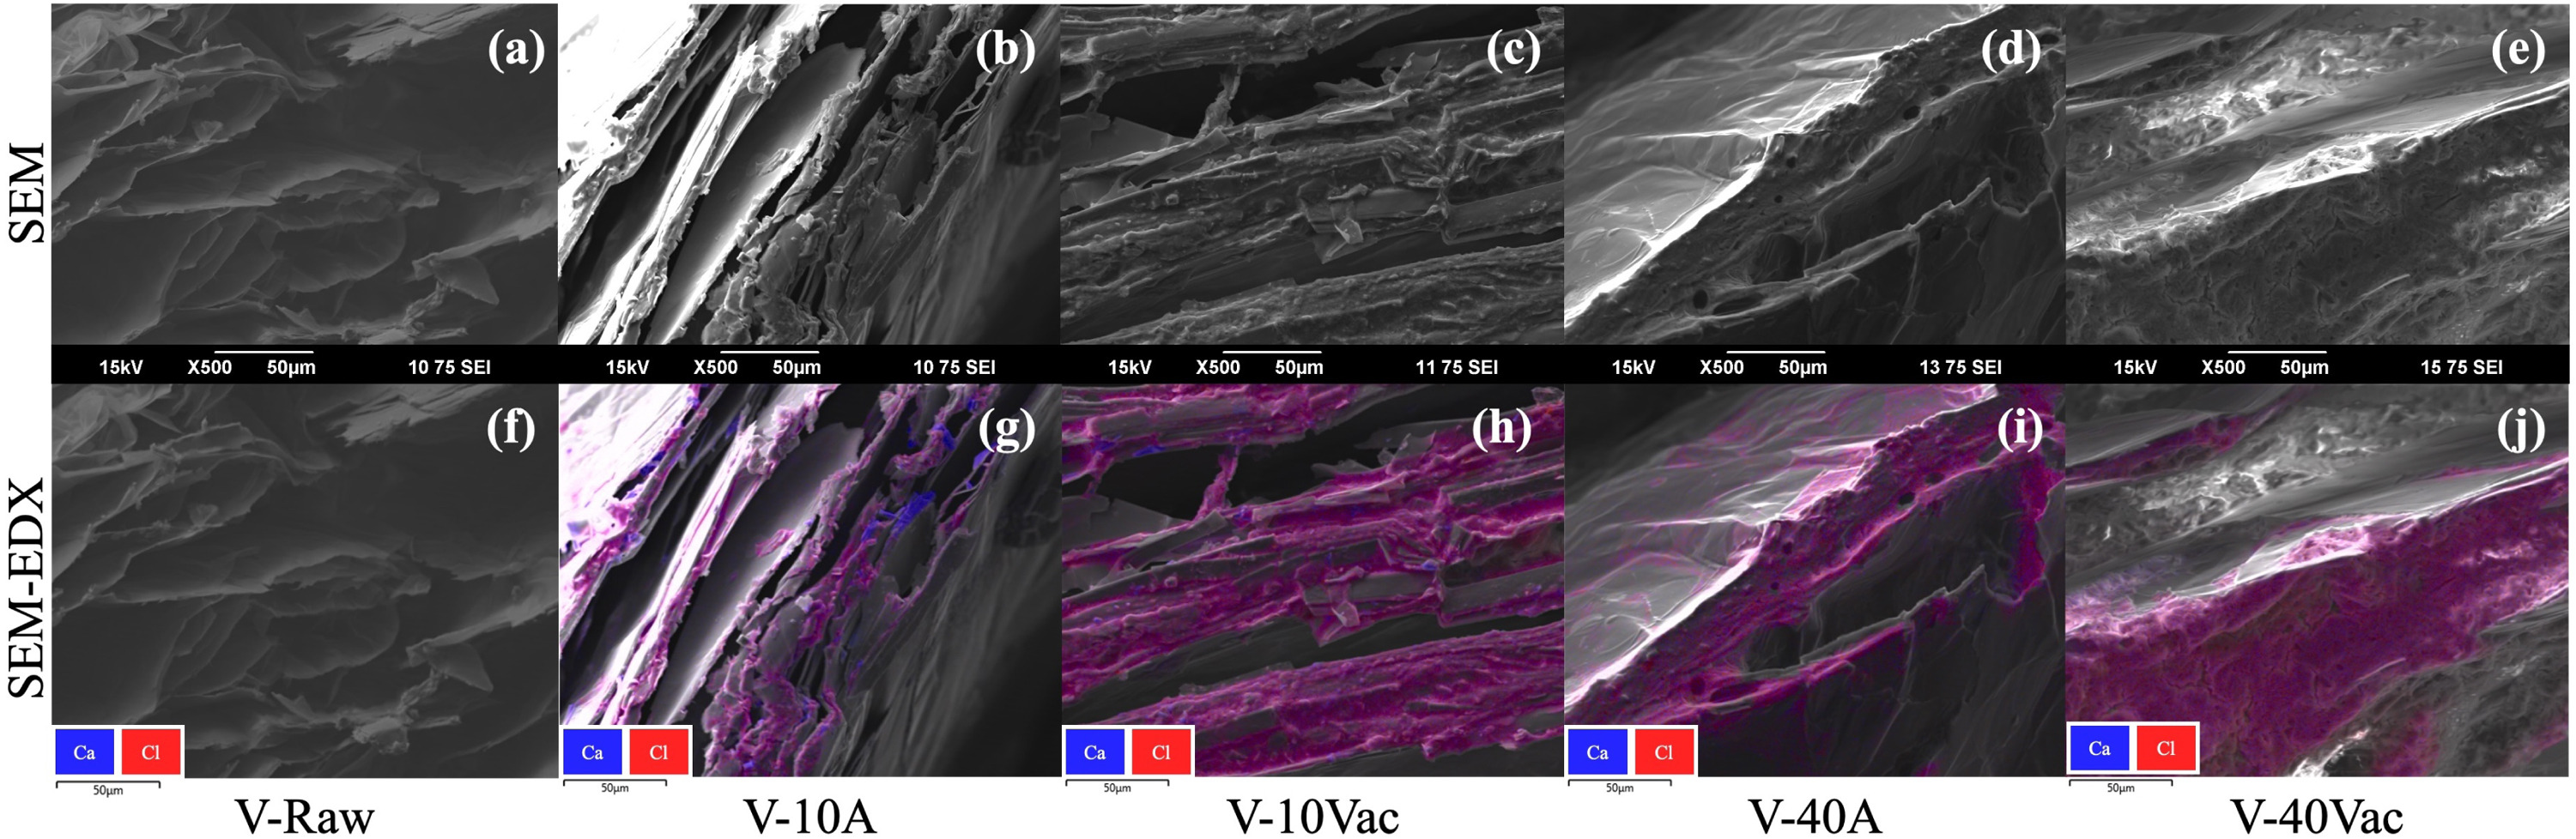
Fig. 5 presents SEM images and EDX elemental maps of pristine vermiculite (V-Raw) and the corresponding vermiculite-CaCl₂ composites. These data were used to assess the structural evolution and the spatial distribution of CaCl₂ within the vermiculite framework.
The pristine vermiculite (V-Raw) displays a well-defined, open lamellar structure with clearly separated interlayer galleries (Figs. 5a,f). The corresponding EDX map confirms the absence of Ca and Cl signals, providing a baseline reference for evaluating salt infiltration in the impregnated samples.
Fig. 5. SEM images (a–e) and EDX elemental mapping (f–j) of pristine vermiculite (V-Raw) and vermiculite-CaCl₂ composites prepared by atmospheric (A) and vacuum-assisted (Vac) impregnation at 10 and 40 wt% solution concentrations. Ca and Cl signals are shown in blue and red, respectively.
At low loading (10 wt%), the interlayer collapse of vermiculite sheets is evident, particularly in the vacuum-assisted-impregnated sample (V-10Vac), where the absence of sufficient salt prevents mechanical reinforcement. In contrast, samples with higher loading (40 wt%) exhibit the formation of crystalline CaCl₂ domains, visible as bright regions in the EDX maps, which act as pillar-like supports that preserve an open lamellar architecture. The impregnation route influences salt distribution at this higher concentration. Atmospheric impregnation (V-40 A) leads to preferential accumulation of CaCl₂ on the external surfaces, resulting in an inhomogeneous loading pattern. Conversely, vacuum-assisted impregnation (V-40Vac) enables deep penetration of the salt into interlayer spaces and internal pores, producing a more uniform distribution throughout the composite matrix.
3.1.2 Density and salt content analysis
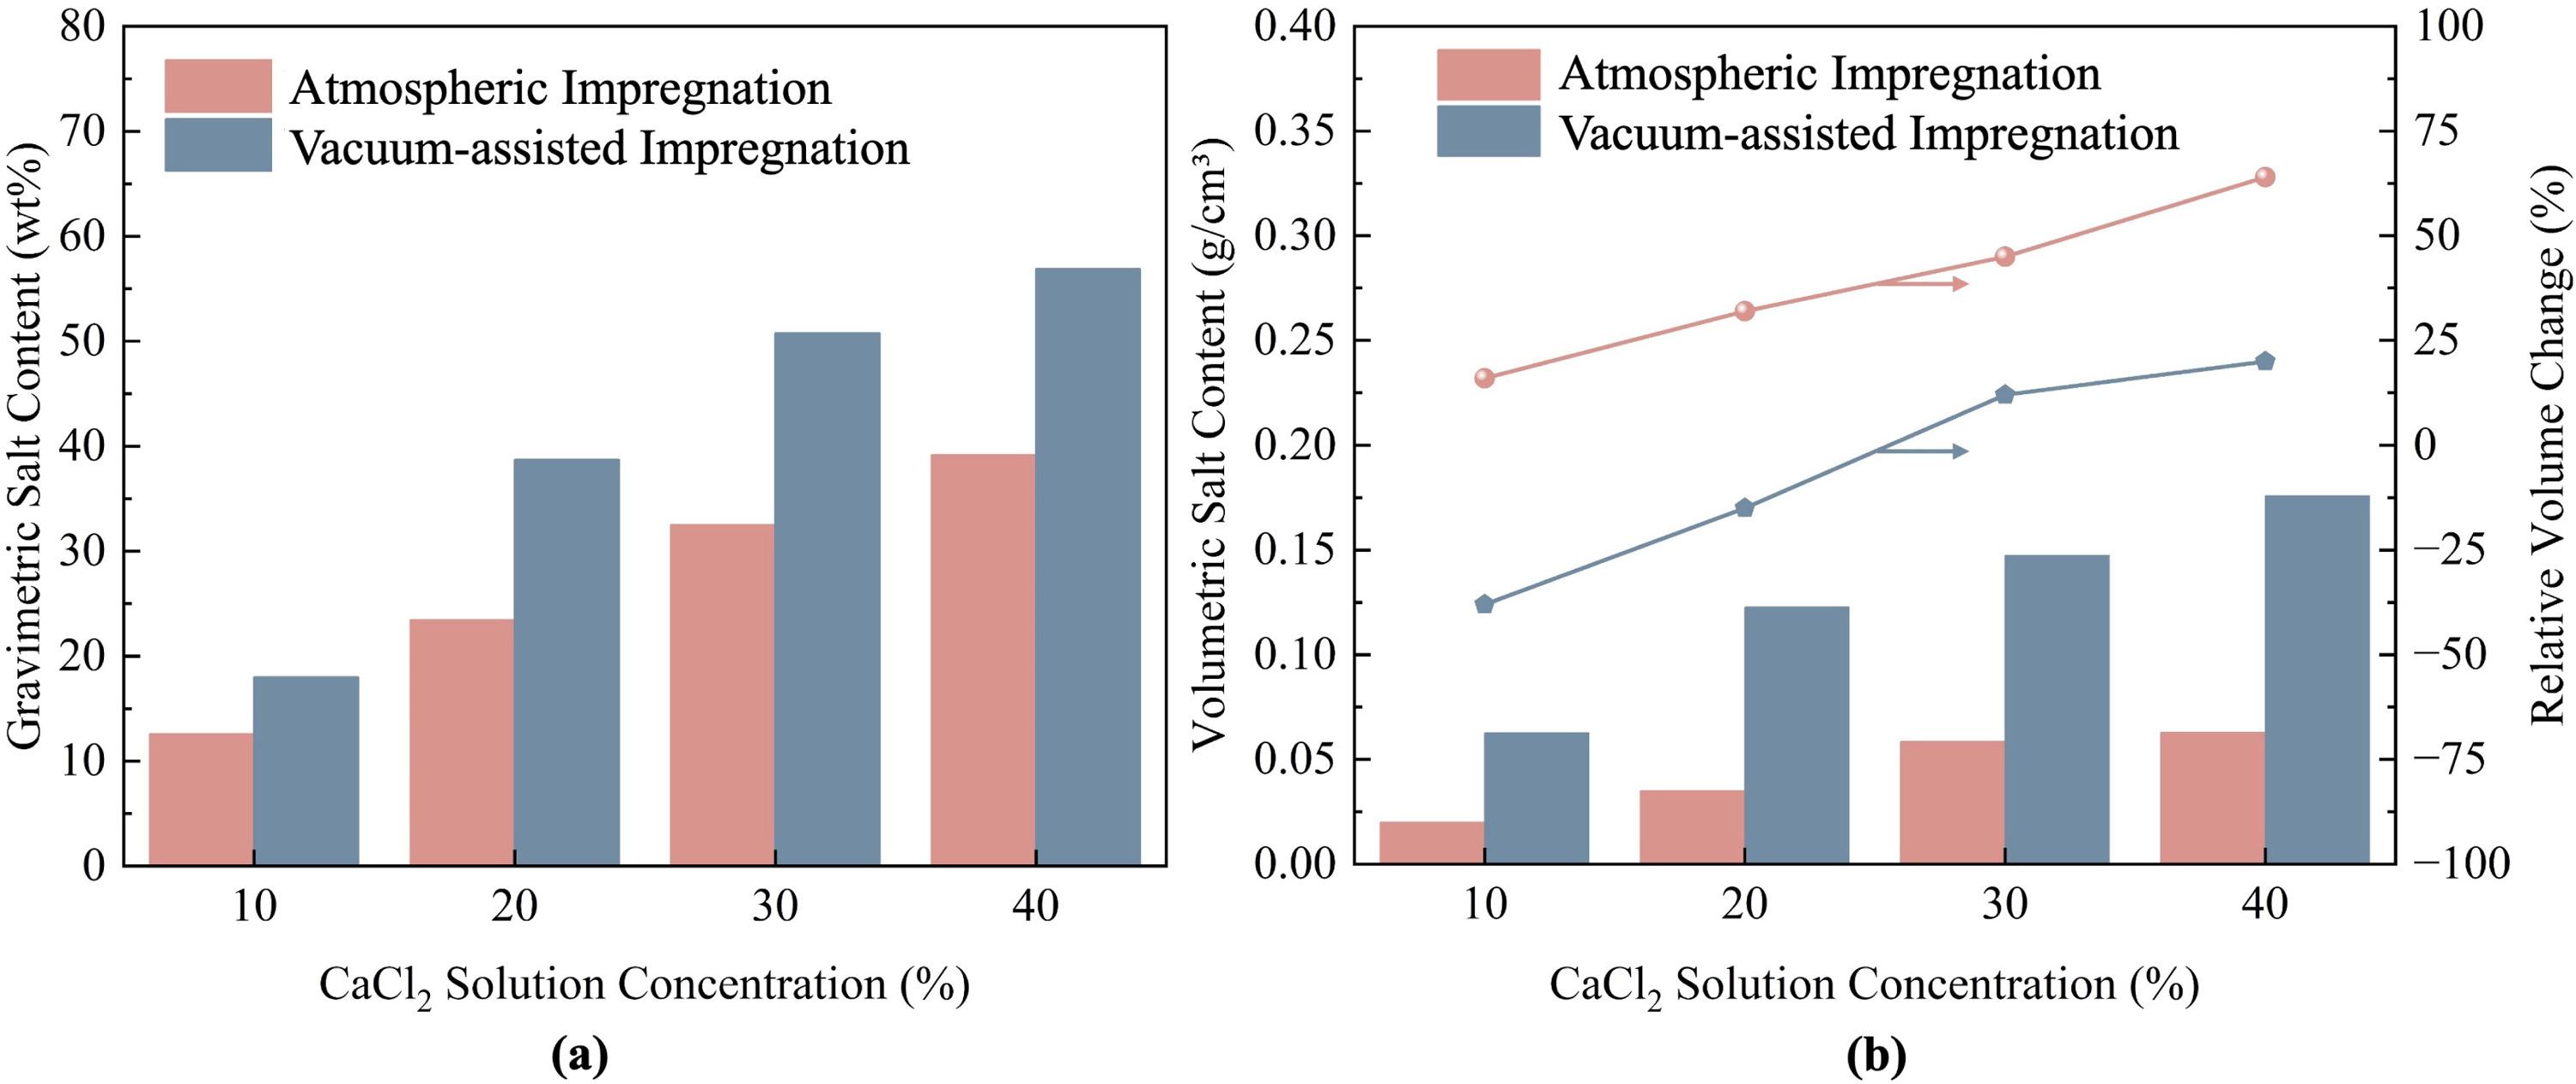
The bulk density, particle density, internal porosity, average particle thickness, and volumetric salt content of the composites were measured to quantify the effects of the impregnation method and solution concentration. The average particle thickness was obtained by measuring five randomly selected particles for each sample using a vernier caliper. Key physical properties are summarized in Table 3, and the corresponding salt content is shown in Fig. 6.
The results indicate that vacuum-assisted impregnation produces composites with significantly higher particle densities than the atmospheric method across all solution concentrations. While the gravimetric salt contents are comparable between the two methods, the large differences in sample volume expansion lead to substantial variations in volumetric salt content. For example, at 10 wt% solution concentration, the vacuum-assisted-impregnated sample (V-10Vac) achieves a volumetric salt content of 0.0626 g cm⁻³, approximately 3.2-fold higher than the atmospheric-impregnated sample (V-10 A) at 0.0198 g cm⁻³. This difference stems from vacuum-induced particle densification: reduced pressure evacuates interlayer gases and promotes solution infiltration, followed by interlayer collapse during drying that significantly reduces particle volume. The resulting shrinkage concentrates more salt mass per unit composite volume, as confirmed by SEM observations.
Table 3. Physical properties of vermiculite-CaCl₂ composites prepared using different impregnation methods and solution concentrations.
Sample
Bulk density (g cm⁻³)
Particle density (g cm⁻³)
Skeletal density (g cm⁻³)
Void fraction (%)
Internal porosity (%)
Average thickness (mm)
V-10A
0.1578
0.3808
1.6146
69.42
76.41
4.89
V-20A
0.1482
0.3052
1.4467
45.04
78.90
6.18
V-30A
0.1795
0.3481
1.5059
41.76
76.88
7.40
V-40A
0.1604
0.3168
1.3881
46.79
77.18
8.89
V-10Vac
0.3480
0.8870
2.4099
50.94
63.19
3.00
V-20Vac
0.3170
0.6797
2.0485
52.08
66.82
3.47
V-30Vac
0.2902
0.6240
2.4096
58.68
74.10
4.36
V-40Vac
0.3092
0.6125
2.2804
54.25
73.14
6.26
Fig. 6. Salt content of the composites: (a) gravimetric salt content; (b) volumetric salt content (left axis) and sample expansion rate (right axis).
Based on these method-dependent differences, solution concentration further modulates the microstructure of the composites. High-concentration solutions exhibit increased viscosity, which limits solution penetration in atmospheric-impregnated samples [38], resulting in salt primarily concentrating near pore openings. Consequently, the atmospheric-impregnated sample at 40 wt% concentration achieves only 0.0628 g cm⁻³ volumetric salt content, comparable to the vacuum-assisted-impregnated sample at 10 wt% concentration. In contrast, vacuum-assisted impregnation utilizes pressure differentials to evacuate trapped air and promote complete solution penetration throughout the matrix.
Samples prepared by vacuum-assisted impregnation exhibit a distinctive two-stage structural evolution with increasing salt concentration. At low concentrations, capillary forces generated during the drying process drive the collapse of the interlayer spaces, producing high particle density (0.8870 g cm⁻³ at 10 wt%) and low internal porosity (63.19 %). At higher concentrations, the substantial volume of crystallized salt creates an internal scaffold that props open the layers and resists this capillary-induced collapse, effectively re-expanding the framework, reducing particle density to 0.6125 g cm⁻³ and increasing internal porosity to 73.14 % at 40 wt%. This evolution confirms the dual role of crystalline salt as both a densifying agent and structural support.
3.1.3 Pore structure characterization
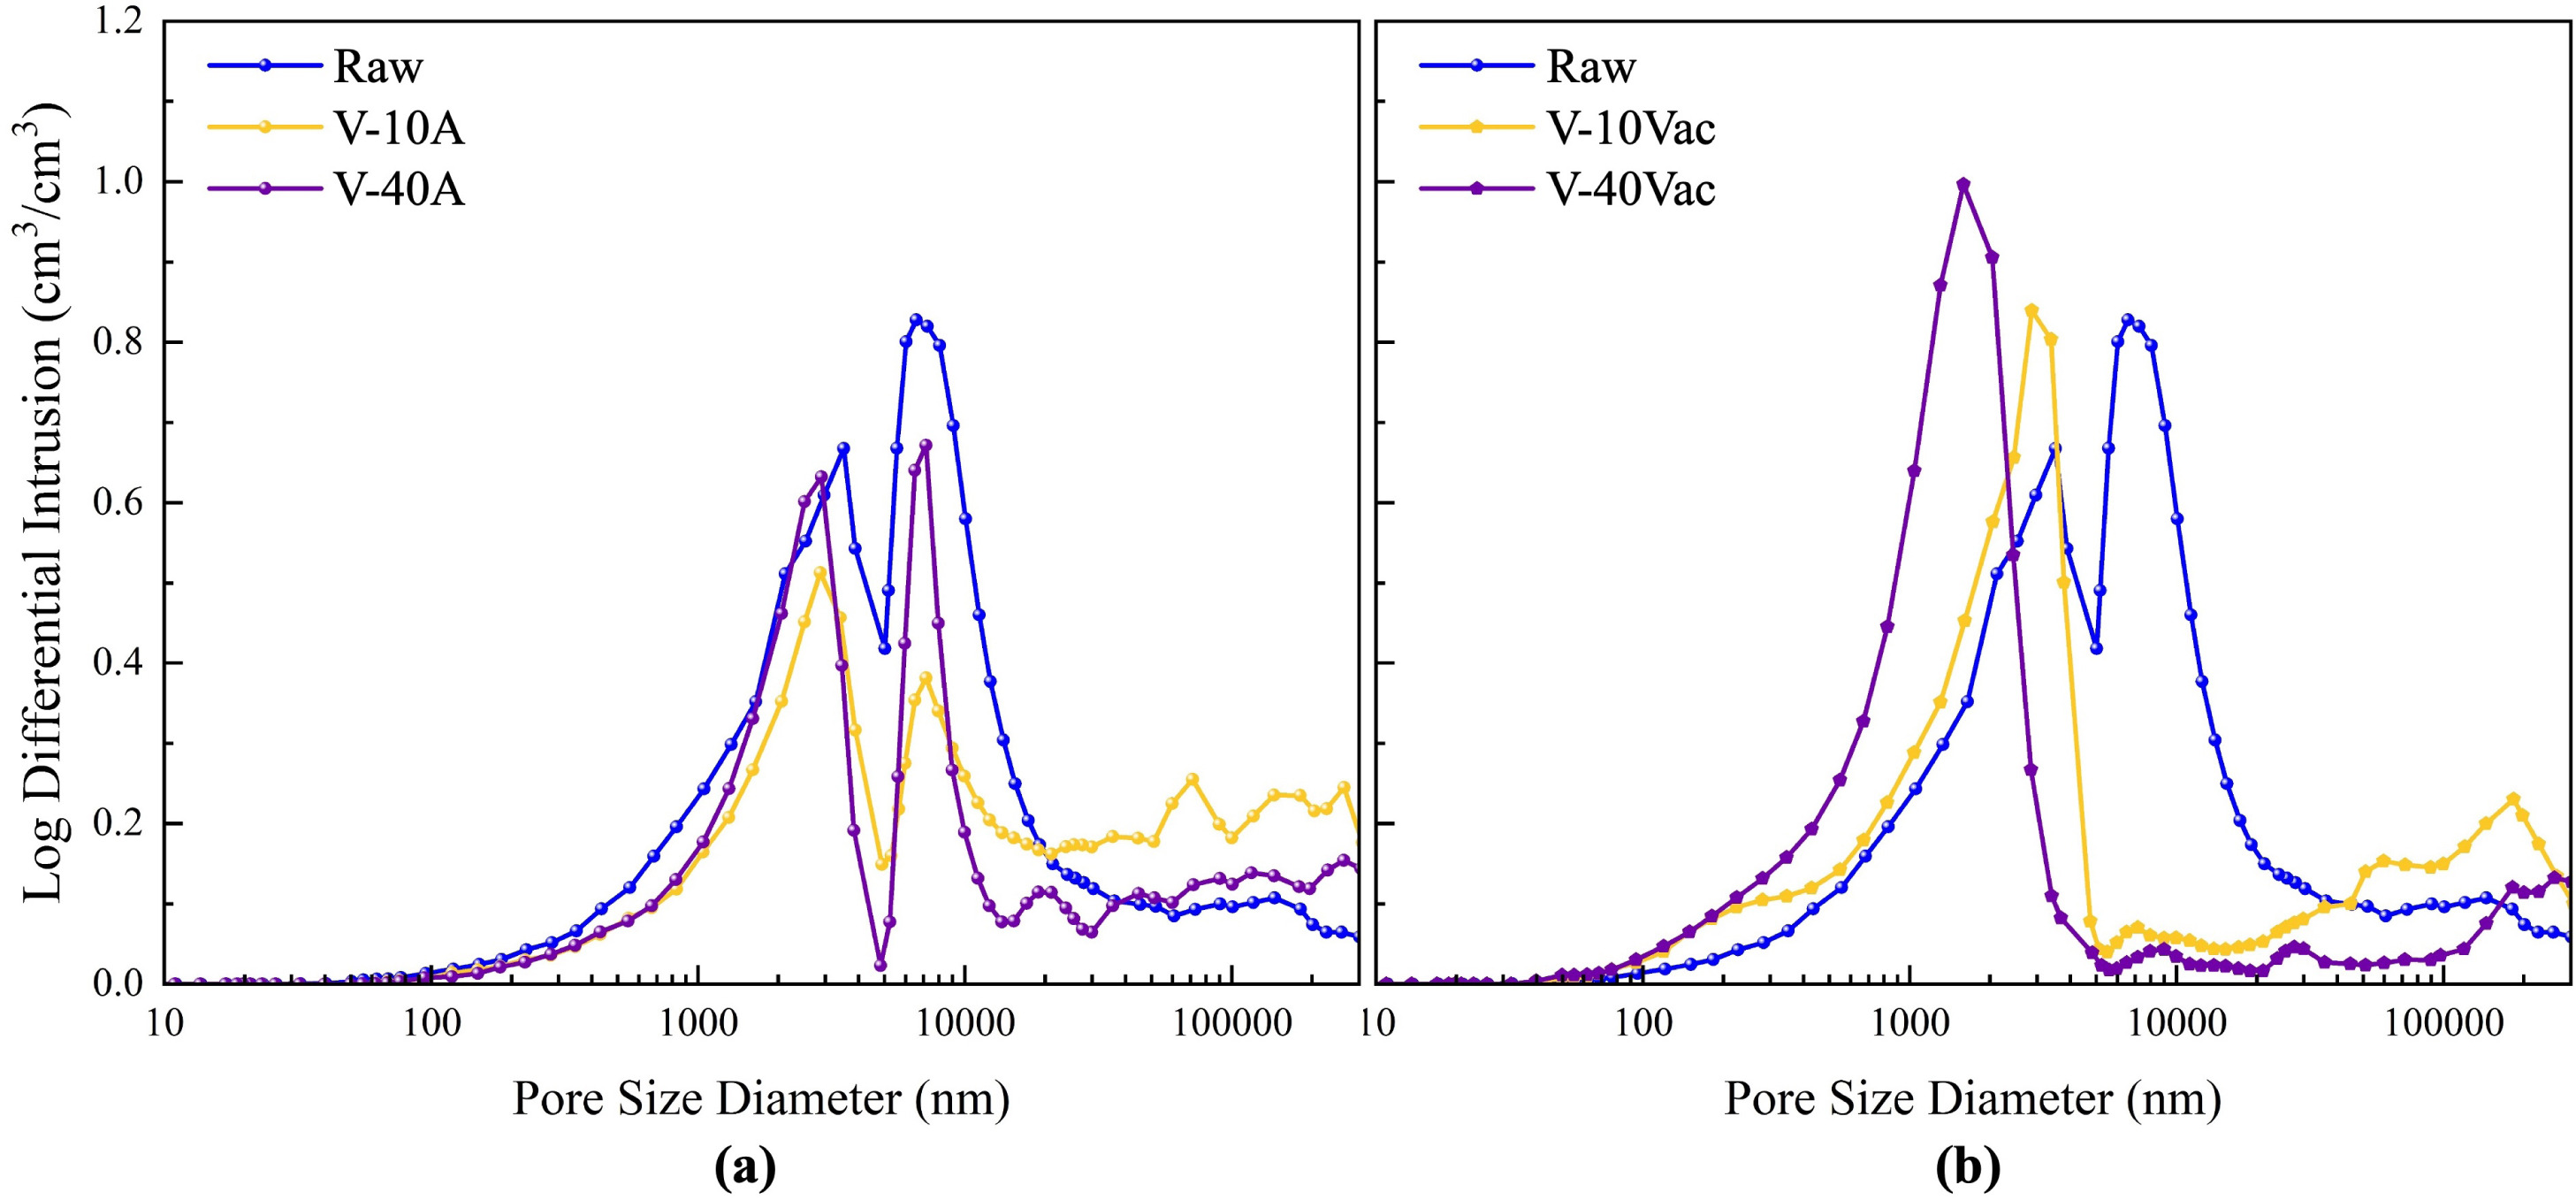
Mercury intrusion porosimetry (MIP) was employed to quantify how salt loading alters the pore architecture of the vermiculite matrix. To enable a direct comparison of pore volume fractions, raw intrusion volumes reported on a mass basis (, cm³
g⁻¹) were converted to a volumetric basis (cm³
cm⁻³) by multiplying by the corresponding particle density (). This conversion removes artifacts arising from density differences between samples. The resulting differential pore size distributions are shown in Fig. 7.
As shown in Fig. 7, raw vermiculite exhibits a distinct bimodal pore size distribution with dominant peaks around 3500 nm and 8000 nm. These peaks represent the inherent macroporous architecture formed between the material’s lamellar layers.
Fig. 7. Pore size distribution of vermiculite-CaCl₂ composites: (a) Atmospheric-impregnated samples; (b) Vacuum-assisted-impregnated samples.
The atmospheric-impregnated samples largely retain this bimodal feature. In sample V-10 A, the peak intensities decrease, suggesting that the salt solution enters and crystallizes within the original pores, acting as a filling agent. Simultaneously, liquid wetting may induce slight swelling of the lamellae, creating some larger voids. For V-40 A, the bimodal pattern persists, but the peaks are markedly suppressed and the first peak shifts towards smaller diameters. This reflects a stronger filling effect where abundant salt crystals not only occupy pore space but also grow on pore walls, narrowing the original channels.
In contrast, vacuum-assisted impregnation disrupted the original bimodal architecture, producing a unimodal distribution. This indicates a structural rearrangement where in-situ salt crystallization forms a templating scaffold that defines a new pore network architecture. For the low-concentration sample (V-10Vac), this sparse crystalline scaffold creates a broad, single peak centred at a larger pore diameter. Conversely, in the high-concentration sample (V-40Vac), a denser crystalline scaffold templates a more refined and uniform pore network, resulting in a sharp, concentrated peak at a smaller diameter.
Collectively, the microstructural analyses provide a consistent and complementary picture of the composite architecture. SEM observations reveal the spatial distribution of salt, confirming that vacuum-assisted impregnation promotes deeper internal penetration compared to the surface-biased accumulation in atmospheric impregnation. This is corroborated by density measurements, which quantify the resulting structural densification and reduced particle thickness in vacuum-assisted-impregnated samples. Furthermore, MIP analysis elucidates the pore-scale consequences, showing how this internal filling transforms the native bimodal pore network into a unimodal, salt-templated structure. Together, these techniques confirm that vacuum-assisted impregnation leads to a denser, more thoroughly filled composite matrix, establishing the structural basis for the volumetric performance differences discussed in the following sections.
3.2 Static sorption performance
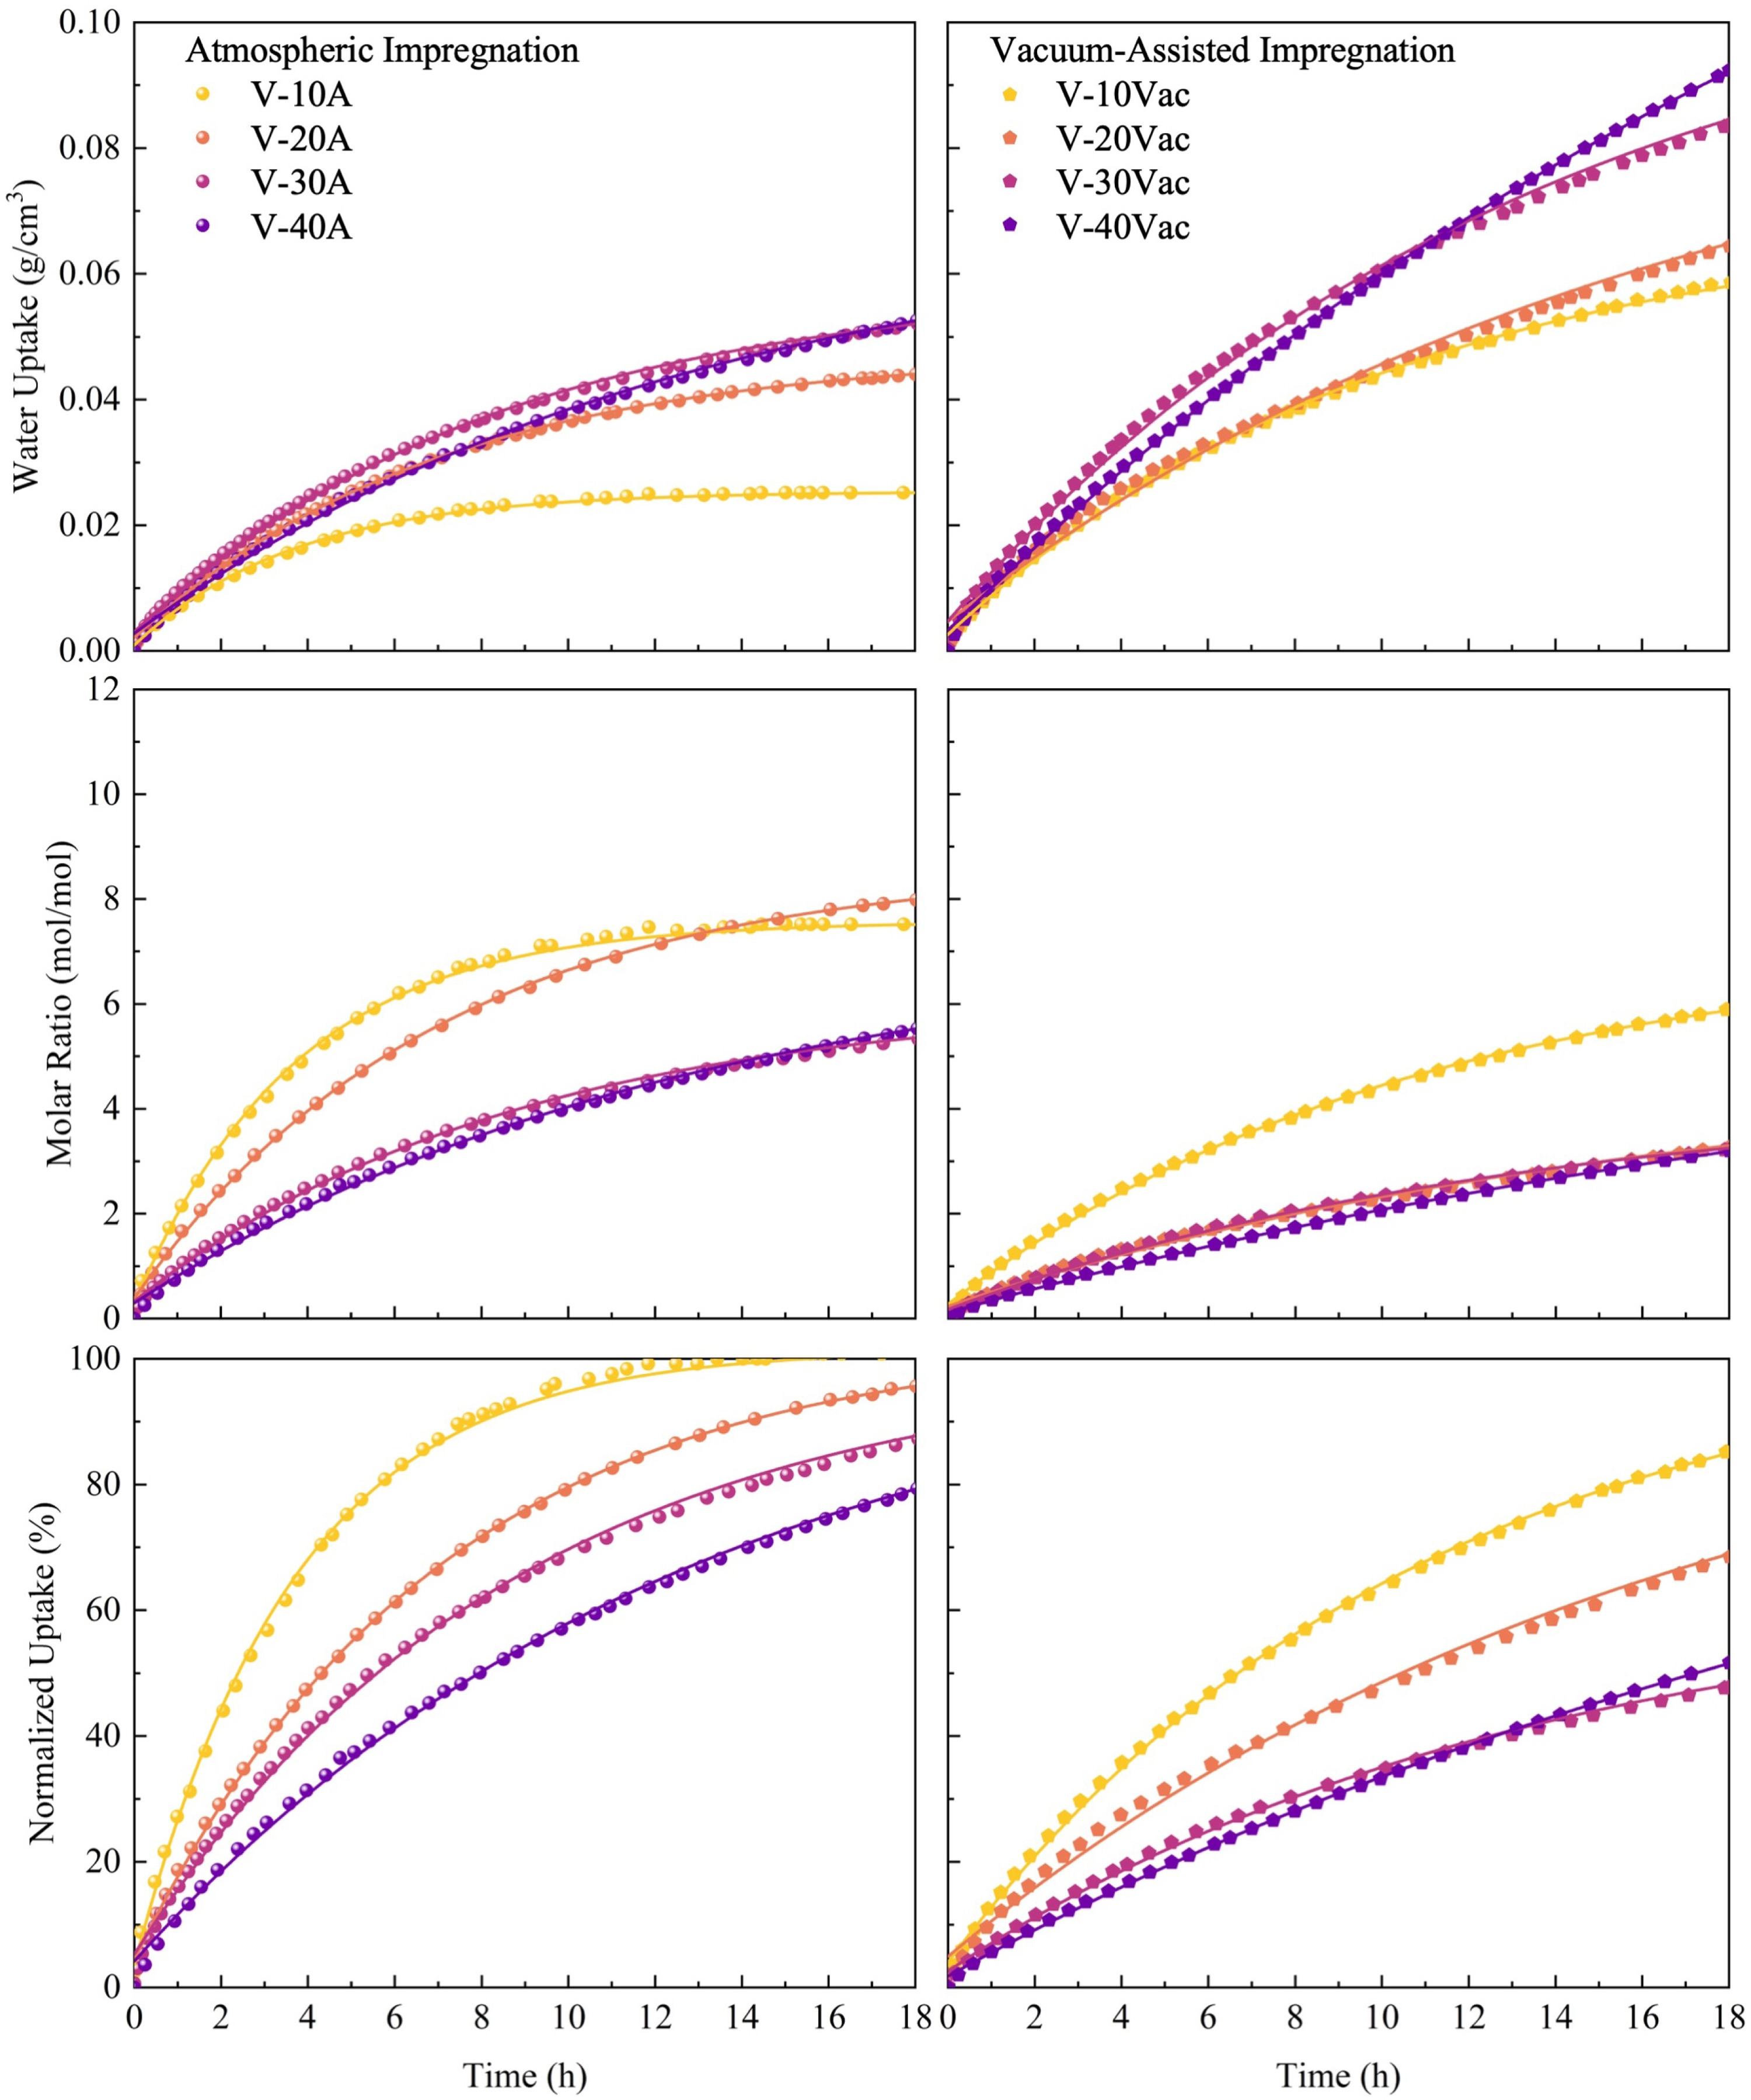
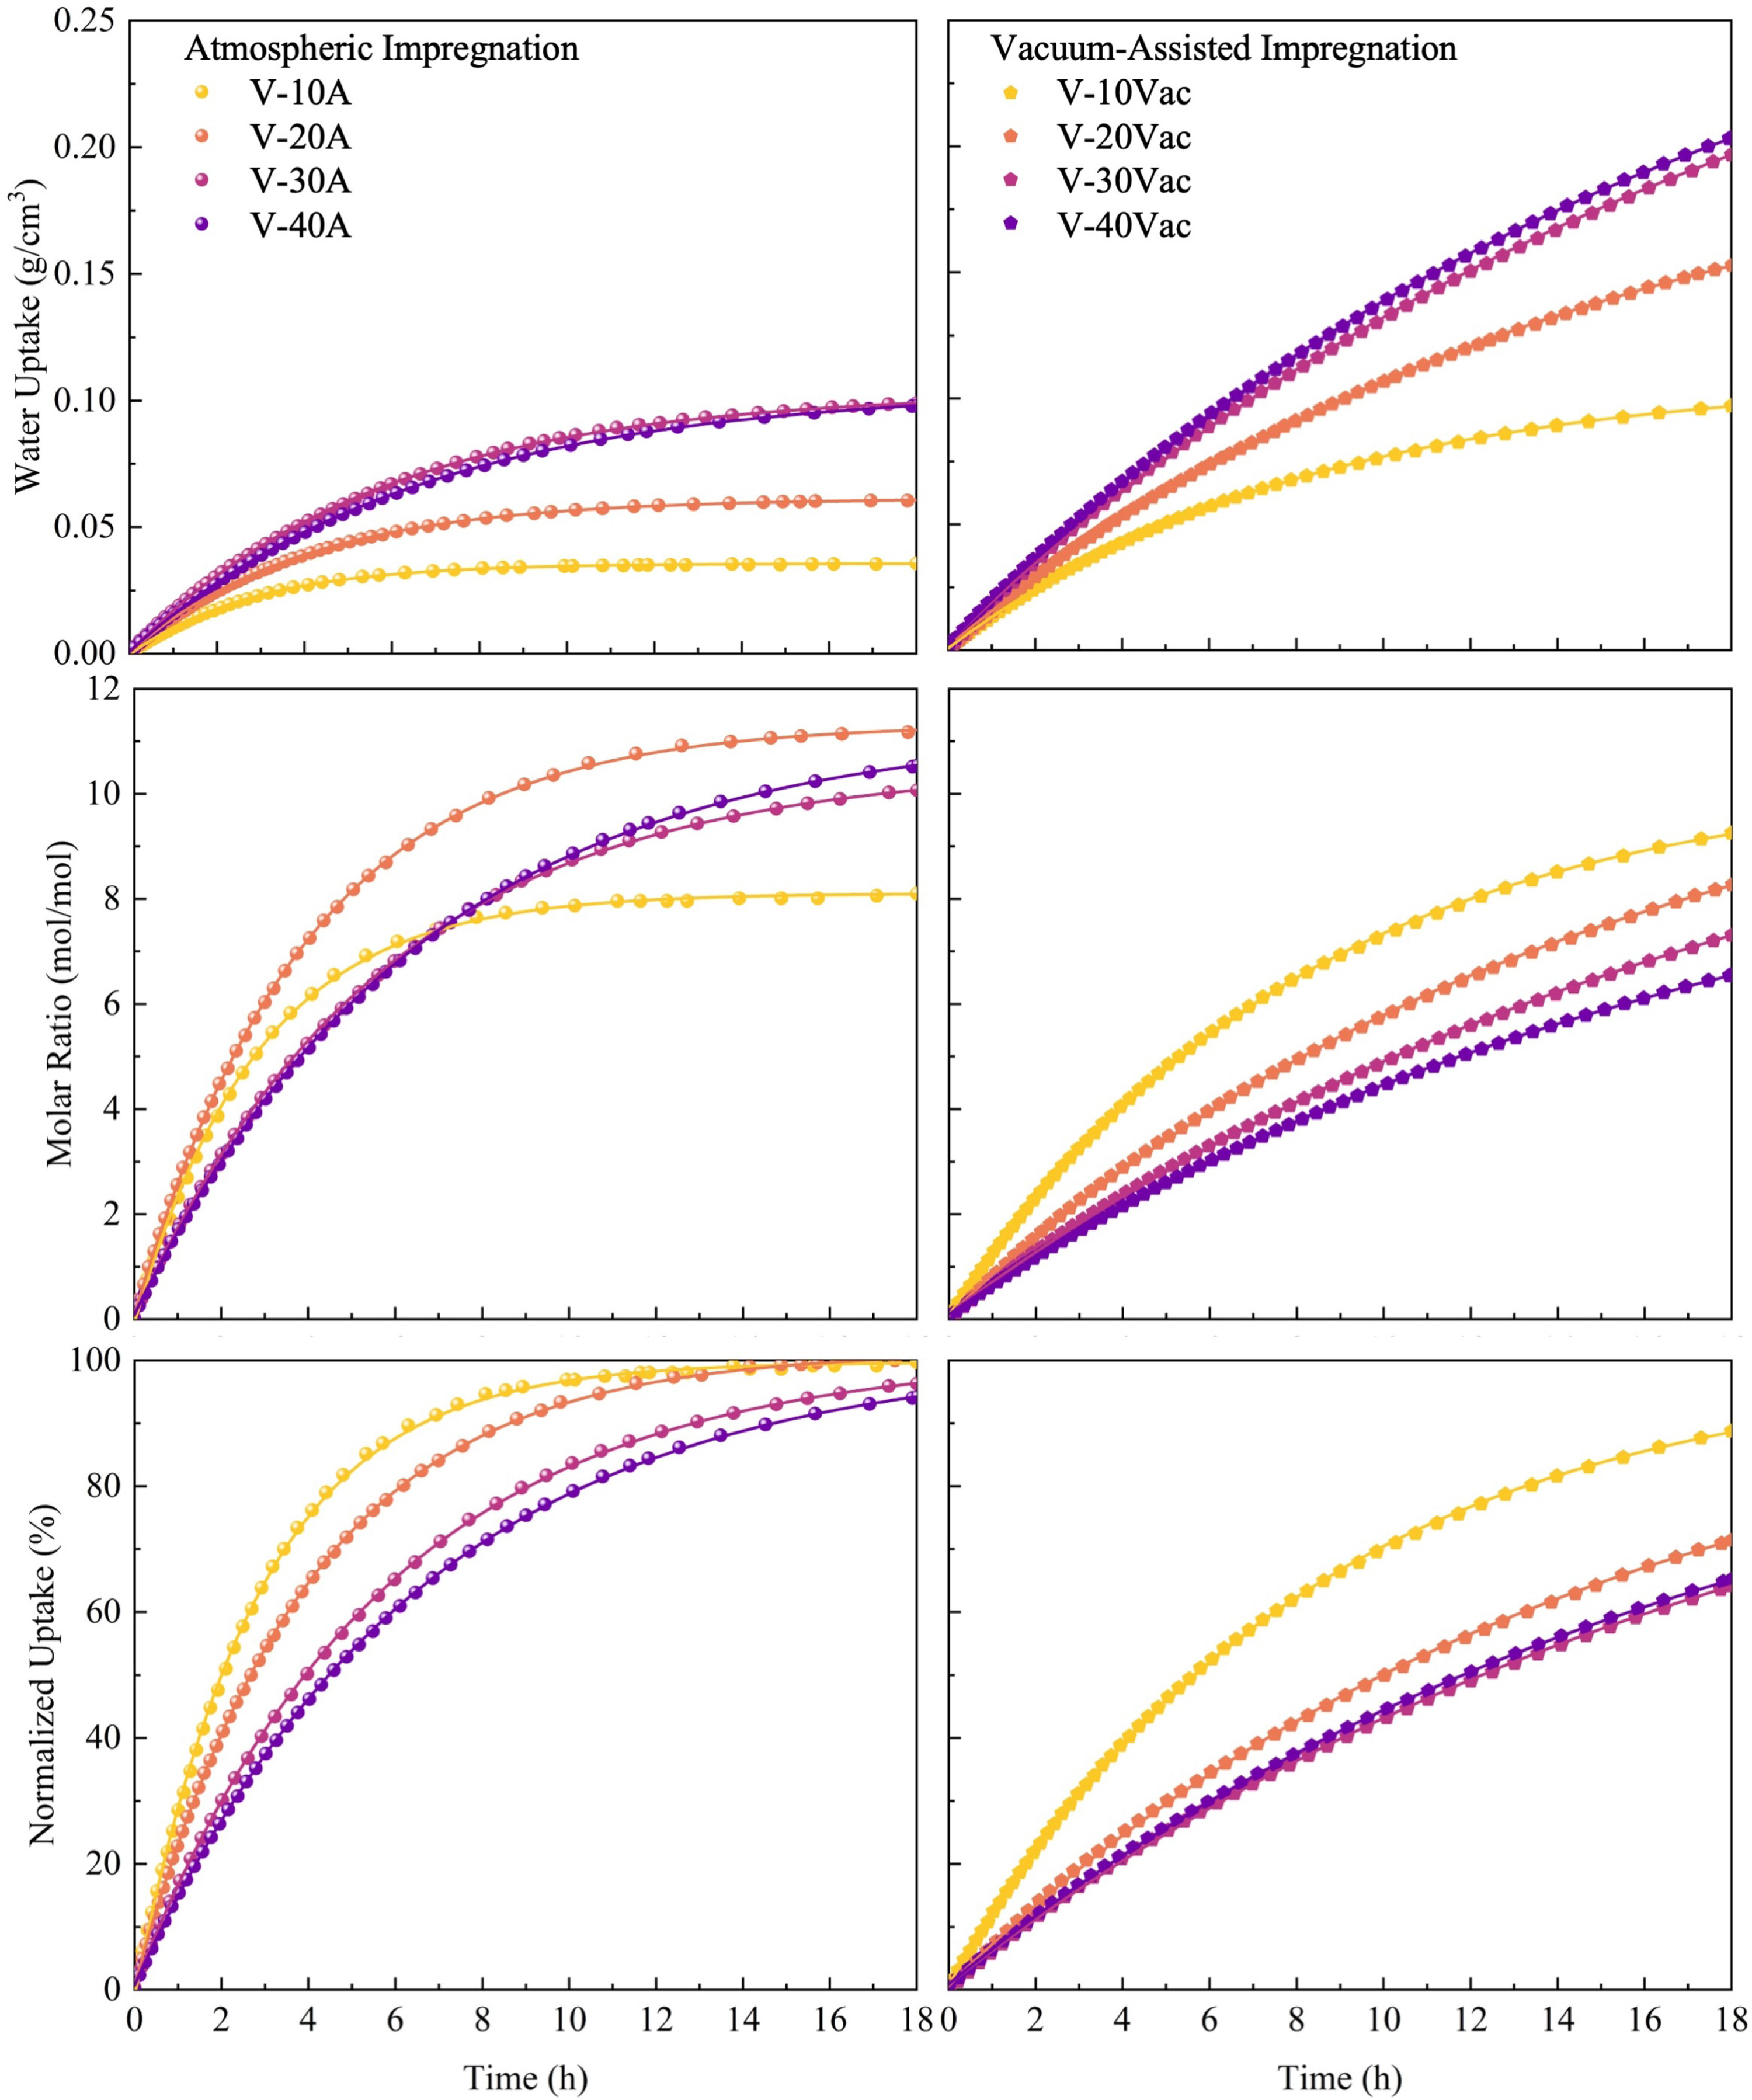
To evaluate the intrinsic sorption kinetics of the prepared composites, static sorption experiments were conducted at 33 % and 53 % relative humidity at 25 °C. In the following analysis, particular attention is paid to how static sorption behaviour varies with volumetric salt content , with impregnation route used to interpret the underlying microstructural mechanisms. [Figs. 8 and 9] present the temporal water uptake profiles for all samples under both humidity conditions. The experimental data were fitted using the first-order kinetic model given in Eq. (6), with extracted parameters summarized in Table 4.
The excellent fitting quality is evidenced by determination coefficients () exceeding 0.99 for all samples, confirming that the first-order kinetic model appropriately describes the sorption processes in these composite materials. When relative humidity increases from 33% to 53%, enhanced water vapour partial pressure significantly improves both equilibrium water uptake () and reaction rate constants (k) across all samples. For instance, V-30 A exhibits an increase in equilibrium uptake from 0.0596 g cm⁻³ to 0.1028 g cm⁻³, while its rate constant nearly doubles from 0.0948 h⁻¹ to 0.1736 h⁻¹, demonstrating that higher humidity simultaneously enhances both sorption capacity and kinetics.
Fig. 8. Static sorption performance of vermiculite-CaCl₂ composites at 33 % relative humidity for atmospheric and vacuum-assisted impregnation composites.Fig. 9. Static sorption performance of vermiculite-CaCl₂ composites at 53 % relative humidity for atmospheric and vacuum-assisted impregnation composites.
Table 4. Kinetic parameters from first-order fitting of static sorption data for vermiculite-CaCl₂ composites at different relative humidities.
Sample
33% Relative humidity k (h⁻¹)
(h)
(g cm⁻³)
(mol mol⁻¹)
53% Relative humidity k (h⁻¹)
(h)
(g cm⁻³)
(mol mol⁻¹)
V-10A
0.2692
8.55
0.0245
7.30
0.9978
0.3646
6.32
0.0357
8.13
0.9981
V-20A
0.1422
16.19
0.0455
8.26
0.9993
0.2599
8.86
0.0604
11.18
0.9993
V-30A
0.0948
24.29
0.0596
6.10
0.9984
0.1736
13.26
0.1028
10.45
0.9999
V-40A
0.0772
29.83
0.0663
6.97
0.9989
0.1517
15.18
0.1040
11.19
1.0000
V-10Vac
0.0920
25.03
0.0688
6.92
0.9995
0.1178
19.55
0.1093
10.43
0.9998
V-20Vac
0.0568
40.54
0.0940
4.79
0.9966
0.0682
33.76
0.2139
11.57
0.9999
V-30Vac
0.0285
80.79
0.1751
6.75
0.9963
0.0575
40.05
0.3064
11.39
0.9995
V-40Vac
0.0382
60.28
0.1789
6.19
0.9998
0.0571
40.33
0.3120
10.05
1.0000
At a given solution concentration, vacuum-assisted impregnation (Vac) produces composites with higher equilibrium water uptake than atmospheric impregnation (A). For example, at 40 wt% solution concentration under 53% RH, V-40Vac reaches , approximately three times higher than V-40 A ().
Across both preparation routes, the fitted rate constant decreases with increasing volumetric salt content, indicating that the kinetic limitation is governed primarily by rather than the impregnation route. Supporting evidence comes from cross-method comparison: samples with similar but markedly different pore architectures (such as V-30 A and V-10Vac) exhibit comparable kinetic parameters. Mechanistically, increasing salt loading progressively fills pores and narrows diffusion pathways, thereby increasing mass transfer resistance. As reported in similar salt-matrix systems, pore filling with salt and the formation of saline solutions reduces water diffusivity in the composite, thus decreasing vapour absorption kinetics [12].
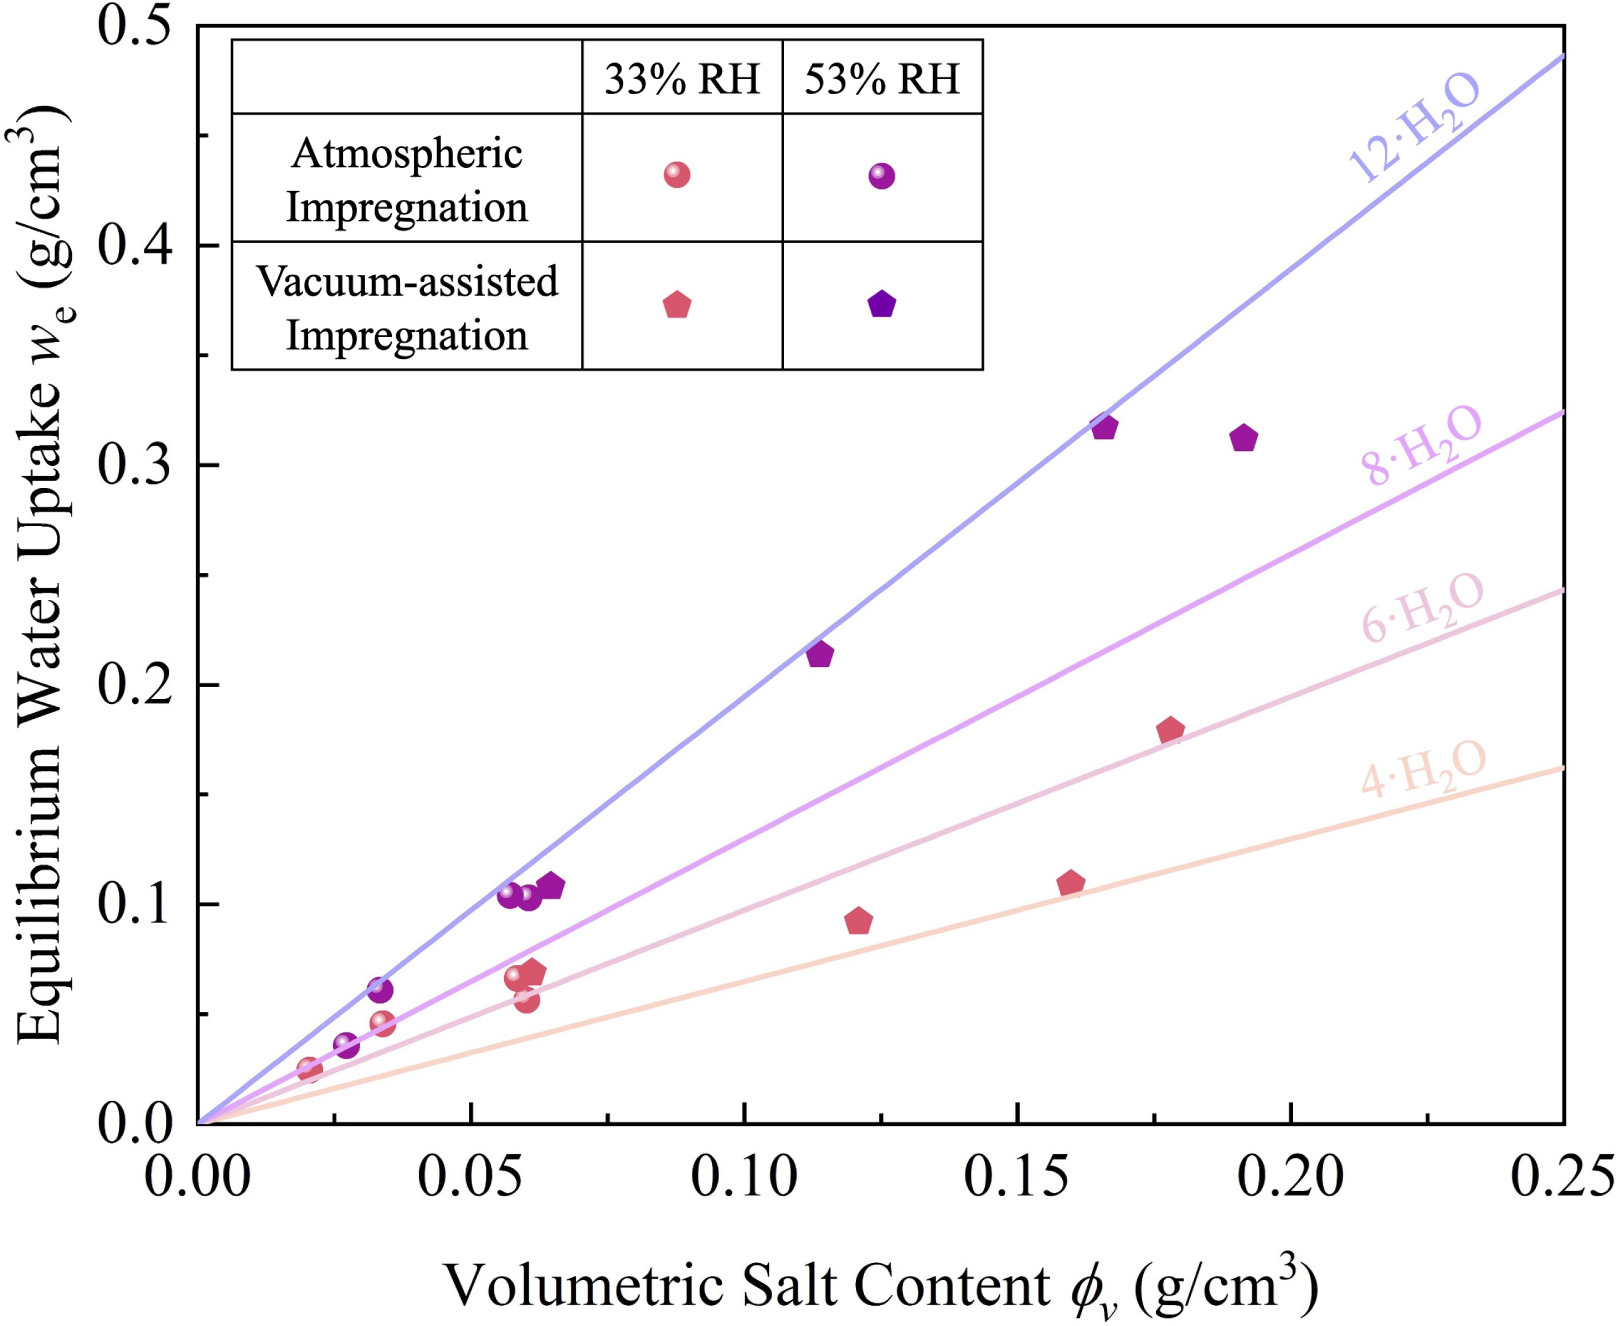
Fig. 10 illustrates the relationship between volumetric salt content and equilibrium water uptake.
The equilibrium water uptake () increases approximately linearly with volumetric salt content (), particularly evident in the low-to-moderate loading range (). Samples tested at 53% RH consistently achieve significantly higher uptake than those at 33% RH, confirming the strong humidity dependence of the sorption process. However, at high salt loadings, the growth rate of diminishes, with some vacuum-assisted impregnated samples potentially falling below the linear trend observed at lower loadings. This modest deviation may reflect partial salt conversion in high-loading composites, where excessive salt filling narrows the pore channels and increases tortuosity. Such structural modifications may impede water vapour diffusion from the external surface to interior regions. Consequently, some salt may contribute less to uptake within the experimental timescale, even though sorption at 53% RH proceeds under deliquescence conditions. This behaviour is primarily observed at the highest loadings, where pore filling is expected to exacerbate mass transfer limitations.
Fig. 10. Equilibrium water uptake () as a function of volumetric salt content () for vermiculite-CaCl₂ composites under different relative humidity conditions.
3.3 Dynamic thermal performance
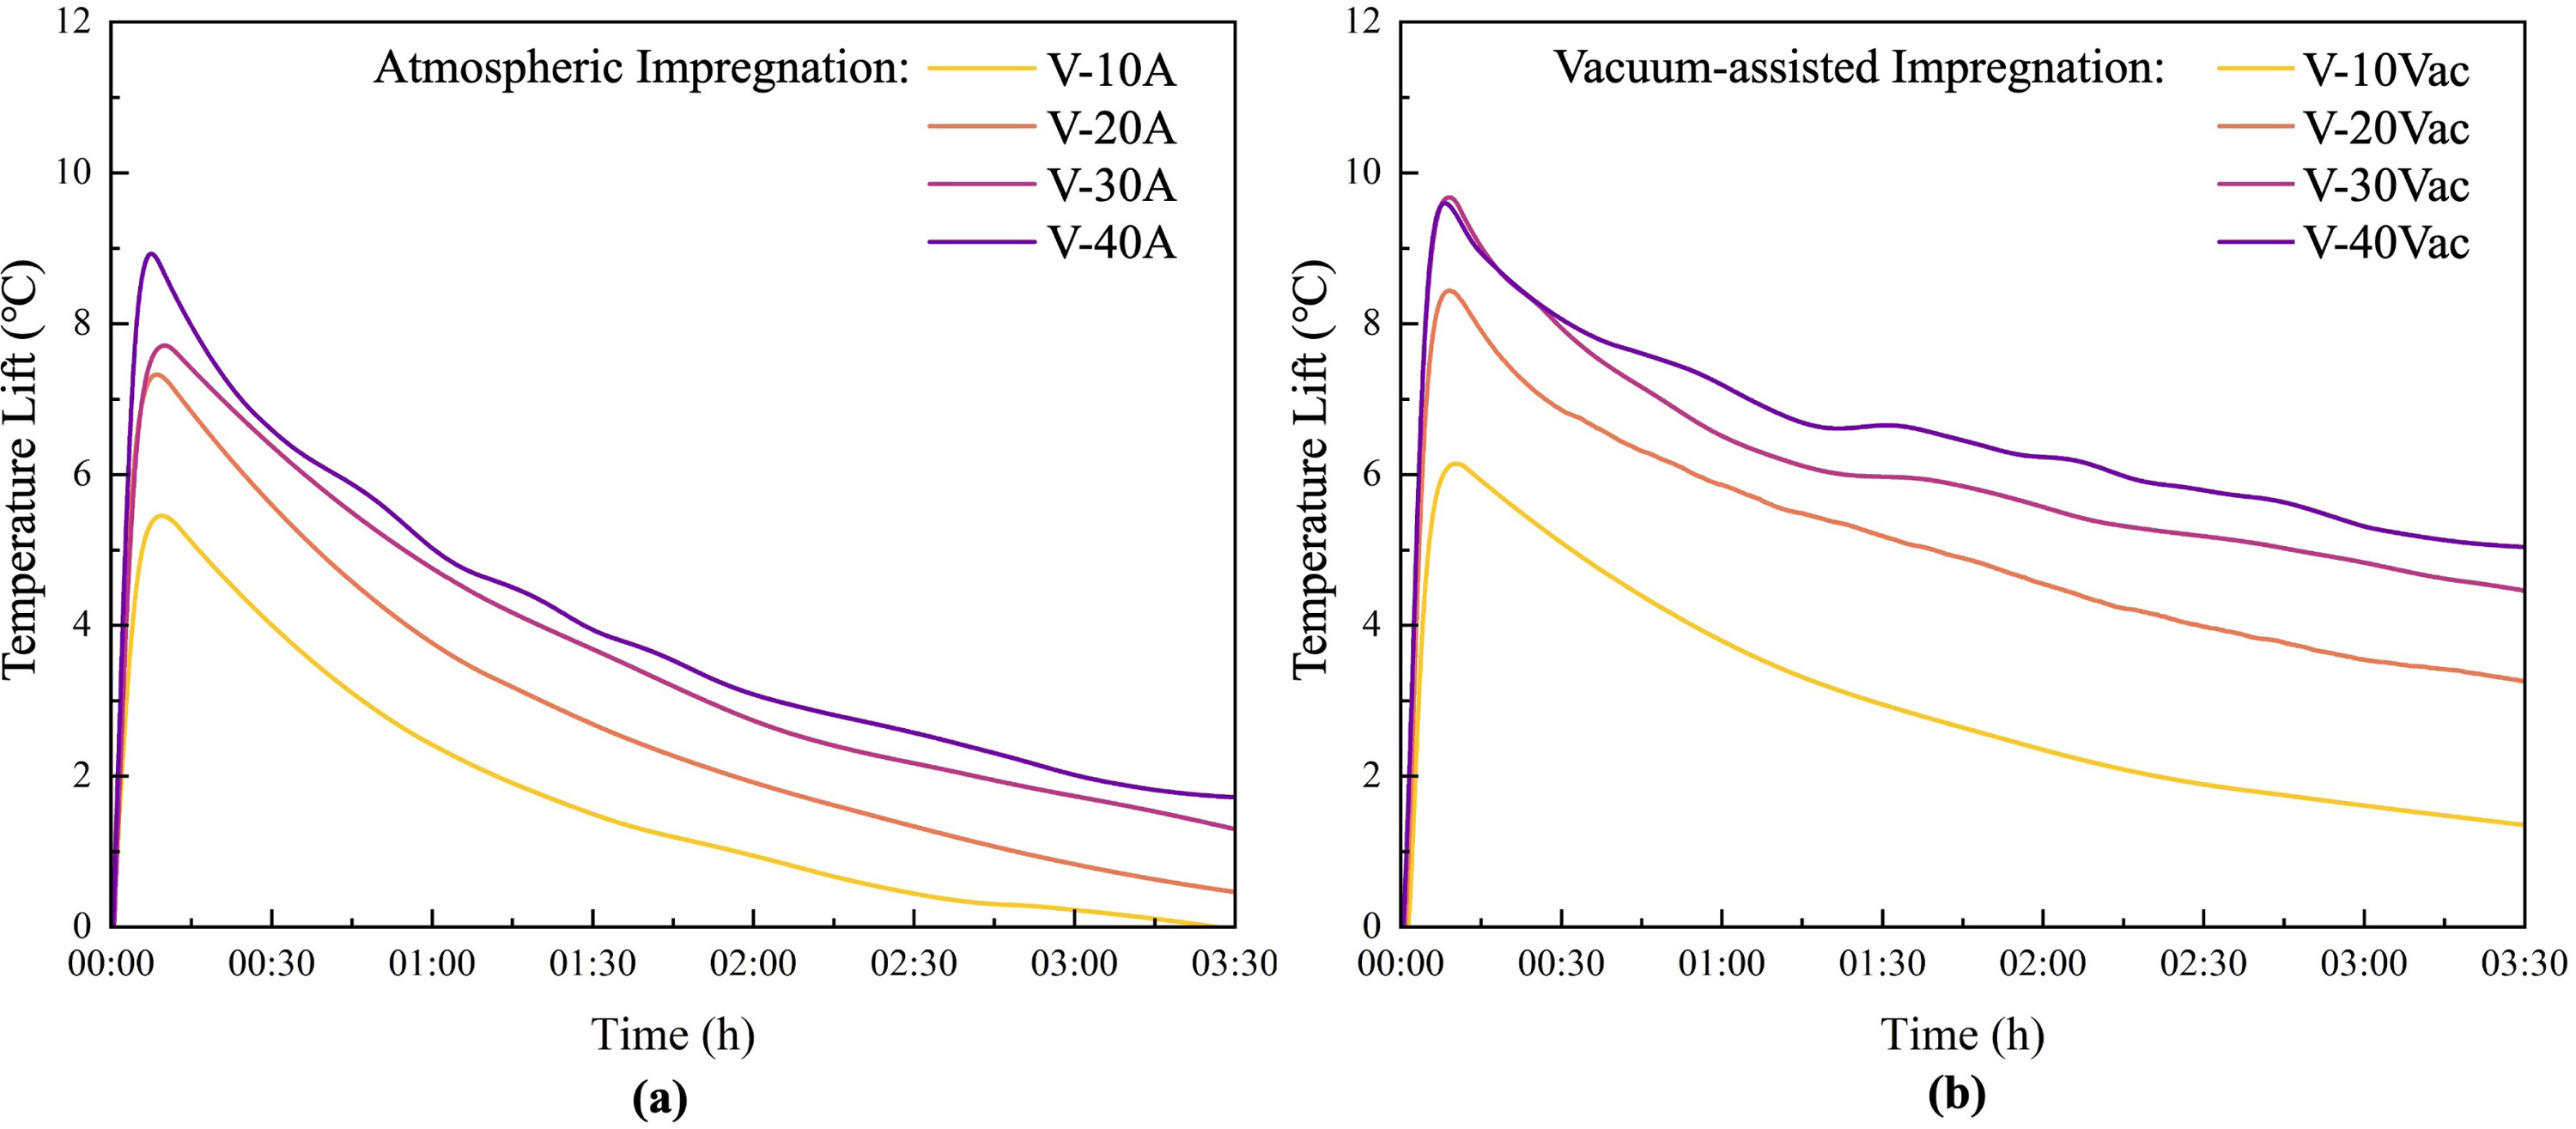
Dynamic sorption experiments were conducted to evaluate the macroscopic thermal response and practical heat output capabilities under flowing air conditions. The temperature rise profiles for all composite samples are presented in Fig. 11, obtained under controlled inlet conditions.
To quantify the dynamic performance characteristics, several key parameters were extracted from the experimental data: average pressure drop () across the packed bed indicating flow resistance, average temperature rise () representing overall thermal performance, maximum temperature rise () showing peak heat output, time to reach peak temperature () characterizing reaction kinetics, sustained temperature rise after 3.5 h () evaluating long-term thermal output, initial dry mass (), water uptake during discharge (Δm), and final hydration ratio () indicating the extent of salt conversion. The inclusion of and Δm enables direct inspection of the mass and energy balance for each test. The 3.5 h evaluation time was selected as it represents the period when all characteristic features have been completed, thermal decay has stabilized, and the materials have not undergone overhydration that could compromise their structural integrity. The extracted dynamic performance parameters for all samples are summarized in Table 5.
Fig. 11. Dynamic temperature rise profiles of vermiculite-CaCl₂ composites during hydration under flowing air (inlet: 25 °C, 50% relative humidity; inlet air velocity: 0.2 m s⁻¹): (a) Atmospheric-impregnated samples; (b) Vacuum-assisted-impregnated samples.
The temperature profiles reveal that all samples exhibit characteristic exothermic sorption behaviour: rapid temperature rise within the initial moments, reaching peak temperature () within approximately 7–10 min, followed by gradual thermal decay. Different preparation methods and salt loadings result in significant variations in peak temperature, decay rates, and thermal sustainability.
Table 5. Dynamic performance characteristics of vermiculite-CaCl₂ composites under flowing air conditions.
Sample
(Pa)
(°C)
(°C)
(min)
(°C)
(g)
Δm (g)
(mol mol⁻¹)
V-10A
11.82
1.69
5.52
8.67
0.00
155
36
11.50
V-20A
10.12
2.79
7.42
7.92
0.45
139
54
10.30
V-30A
8.52
3.62
7.81
9.50
1.42
181
80
8.39
V-40A
8.68
4.00
9.10
7.17
1.71
155
81
8.26
V-10Vac
24.42
2.96
6.18
9.25
1.39
342
72
7.22
V-20Vac
11.34
5.00
8.47
8.58
3.26
318
115
5.76
V-30Vac
9.42
6.00
9.72
8.50
4.45
297
128
5.22
V-40Vac
8.33
6.51
9.69
7.75
4.90
306
132
4.68
Atmospheric-impregnated samples demonstrate rapid initial temperature rise followed by fast decay, while vacuum-assisted-impregnated samples exhibited more gradual curves with sustained elevated temperatures after reaching peak values, indicating better thermal persistence. For instance, after 3.5 h, V-40Vac maintains a residual temperature rise of 4.90 °C, whereas the atmospheric-impregnated sample V-40 A decays to only 1.71 °C.
Despite atmospheric-impregnated samples demonstrating significantly faster reaction kinetics in static tests, they do not achieve higher peak temperatures () or shorter peak times () in dynamic experiments. This phenomenon can be attributed to the higher volumetric salt content in vacuum-assisted-impregnated samples, which provide more reactive material per unit volume for heat generation under identical conditions. The combination of higher volumetric salt content and slower reaction kinetics enables vacuum-assisted-impregnated samples to achieve sustained heat output, as evidenced by the final hydration ratios indicating substantial remaining energy storage capacity.
Pressure drop levels are primarily influenced by particle morphology and packing characteristics, with the severely contracted V-10Vac sample exhibiting higher pressure drop due to structural collapse and increased particle density that reduces interparticle void space. All other samples maintain reasonable pressure drop levels, confirming that the observed kinetic limitations at high salt loadings are governed by intra-particle mass transfer resistance rather than macroscopic bed-level flow resistance. Salt concentration increases also exhibit diminishing marginal returns: V-20Vac achieves nearly double the thermal performance compared to V-10Vac, while V-40Vac provides only 10%–20% improvement over V-30Vac. These diminishing returns indicate that for vacuum-assisted impregnation, solution concentrations of 30–40 wt% represent the effective range for high-capacity storage. While V-40Vac offers the highest absolute performance, the marginal gain over V-30Vac is reduced by kinetic limitations, highlighting the trade-off between maximizing volumetric salt content and maintaining rapid reaction rates.
3.4 Discussion
3.4.1 Effect of volumetric salt content on static sorption characteristics
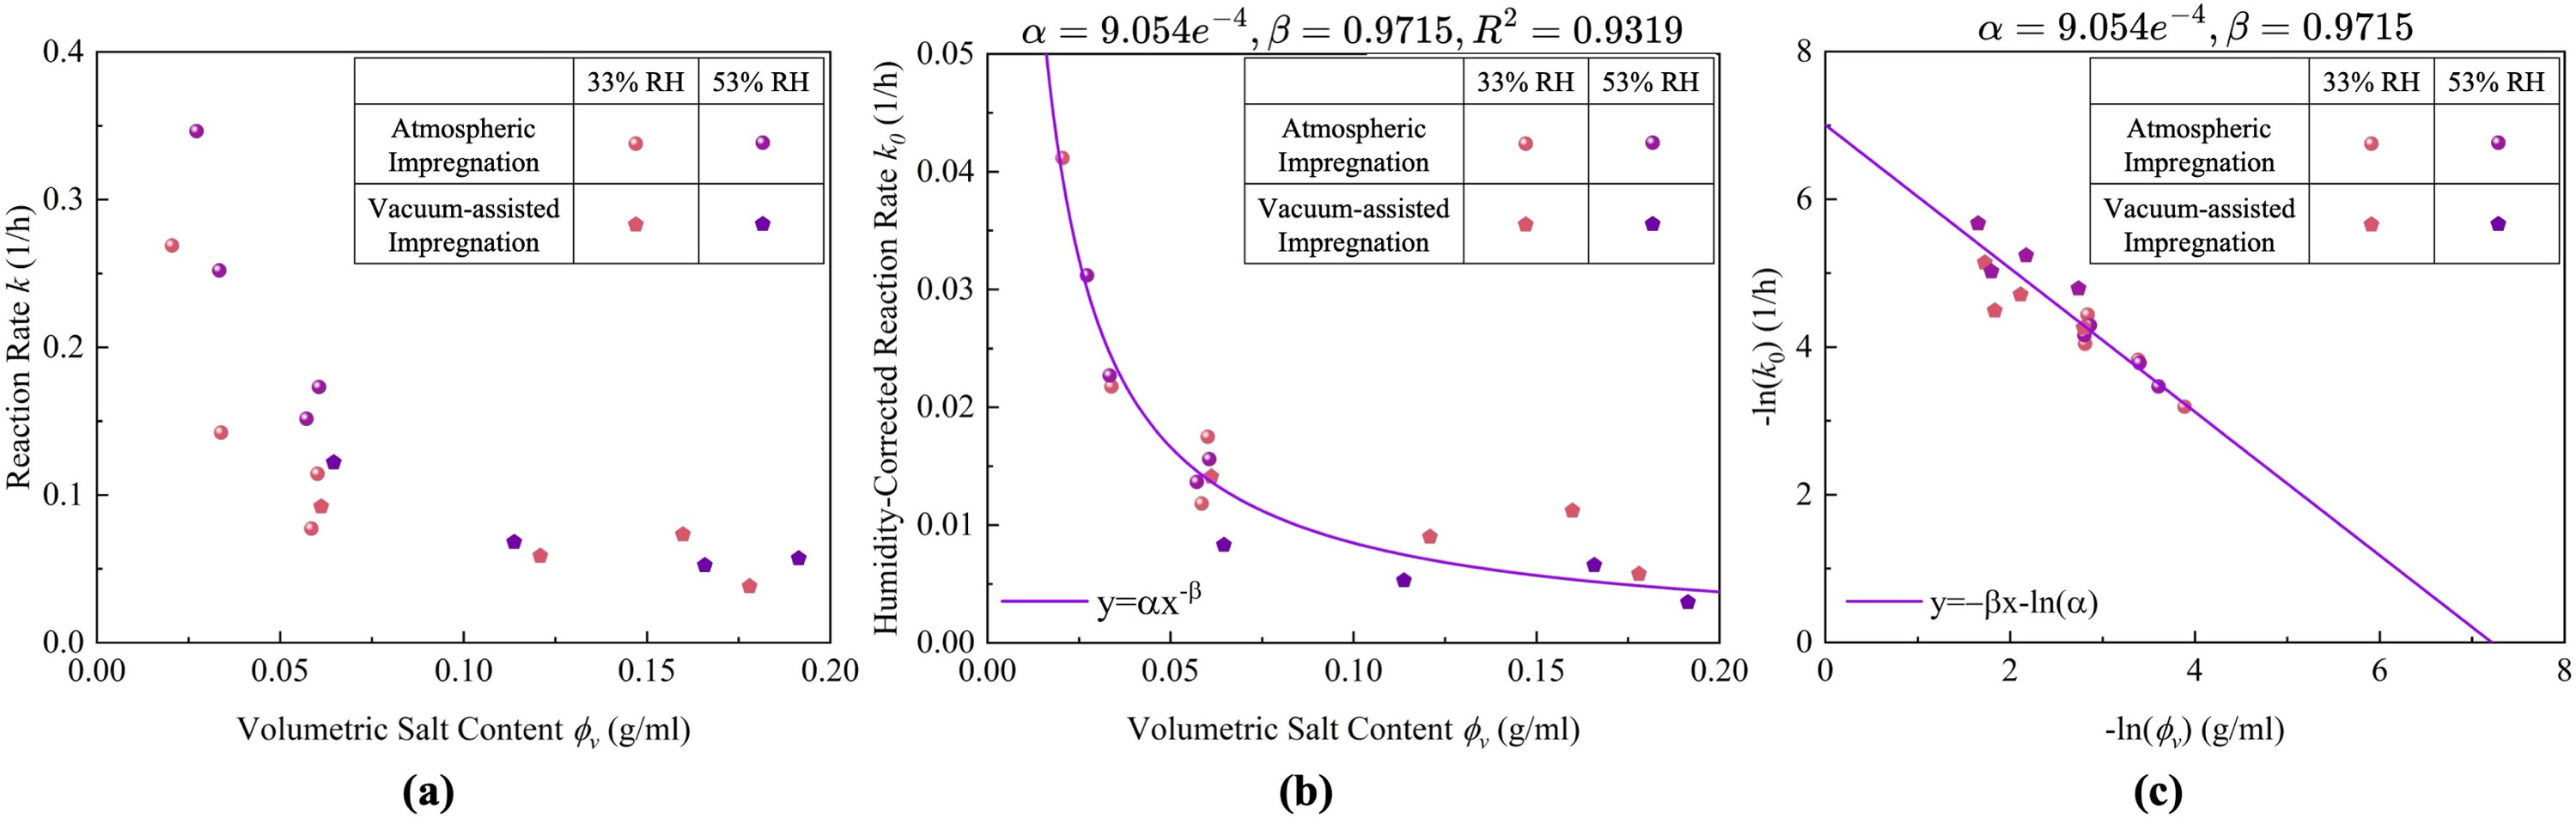
The apparent reaction rate constants (k) obtained at different relative humidities are plotted against volumetric salt content in Fig. 12(a). A consistent inverse relationship is observed: k decreases with increasing for both preparation methods and humidity conditions.
To eliminate the influence of humidity on external driving force, a humidity-corrected rate constant was introduced:
(10)
where P is the experimental water vapour partial pressure. In porous composites, capillary effects and heterogeneous salt distribution shift the effective equilibrium away from ideal thermodynamic values. Therefore, was treated as an empirical fitting parameter representing the macroscopic effective equilibrium vapour pressure. Parameter optimization across the CaCl₂ phase diagram yielded Pa (4.38% RH), positioned between the 2–4 hydration states.
Fig. 12. Relationship between volumetric salt content and reaction rate constant. (a) Apparent reaction rate constants (k) under different humidities; (b) humidity-corrected rate constants () with power-law fitting; (c) logarithmic plot confirming the power-law dependence.
Power-law fitting of the corrected data gave with , , and . The linear relationship in logarithmic coordinates (Fig. 12c) confirms the validity of this model. After correction, data from both humidity levels collapse onto a single trend, indicating that remaining variation in reflects material-intrinsic factors rather than ambient conditions.
This result identifies volumetric salt content as the primary parameter controlling intrinsic sorption kinetics. Supporting evidence comes from samples with similar but different microstructures: V-30 A, V-40 A, and V-10Vac all exhibit –0.063 g cm⁻³, yet their particle densities differ by a factor of 2.8 and internal porosities vary by 14 percentage points. Despite these structural differences, rate constants cluster within a narrow range (23% spread at 33% RH47% at 53% RH). This small kinetic variability relative to the structural disparity indicates that effectively integrates microstructural effects on sorption kinetics.
Residual analysis of the power-law fit revealed no systematic bias between atmospheric (A) and vacuum-assisted (Vac) samples: both routes exhibit similar scatter around the fitted curve without consistent dependence on fabrication method. This confirms that rather than route-specific microstructural differences is the primary determinant of intrinsic kinetics within the investigated parameter space.
Mechanistically, increasing progressively fills pores, causing vapour diffusion pathways to become more tortuous or blocked, which manifests as increased mass transfer resistance and reduced kinetic performance.
The power-law correlation is validated within the deliquescence-driven hydration regime relevant to CaCl₂-based TCES (33%–53% RH at 25 °C; –0.163 g cm⁻³). Both humidity levels lie above the deliquescence threshold (DRH 28%–30%) and represent conditions achievable by preheating outdoor air without active humidification. Extension beyond this range would require additional verification. The correlation enables quantitative prediction of the salt loading–kinetics trade-off, allowing material selection to be tailored to specific applications such as rapid-response daily storage or long-duration seasonal storage.
3.4.2 Effect of volumetric salt content on dynamic sorption characteristics
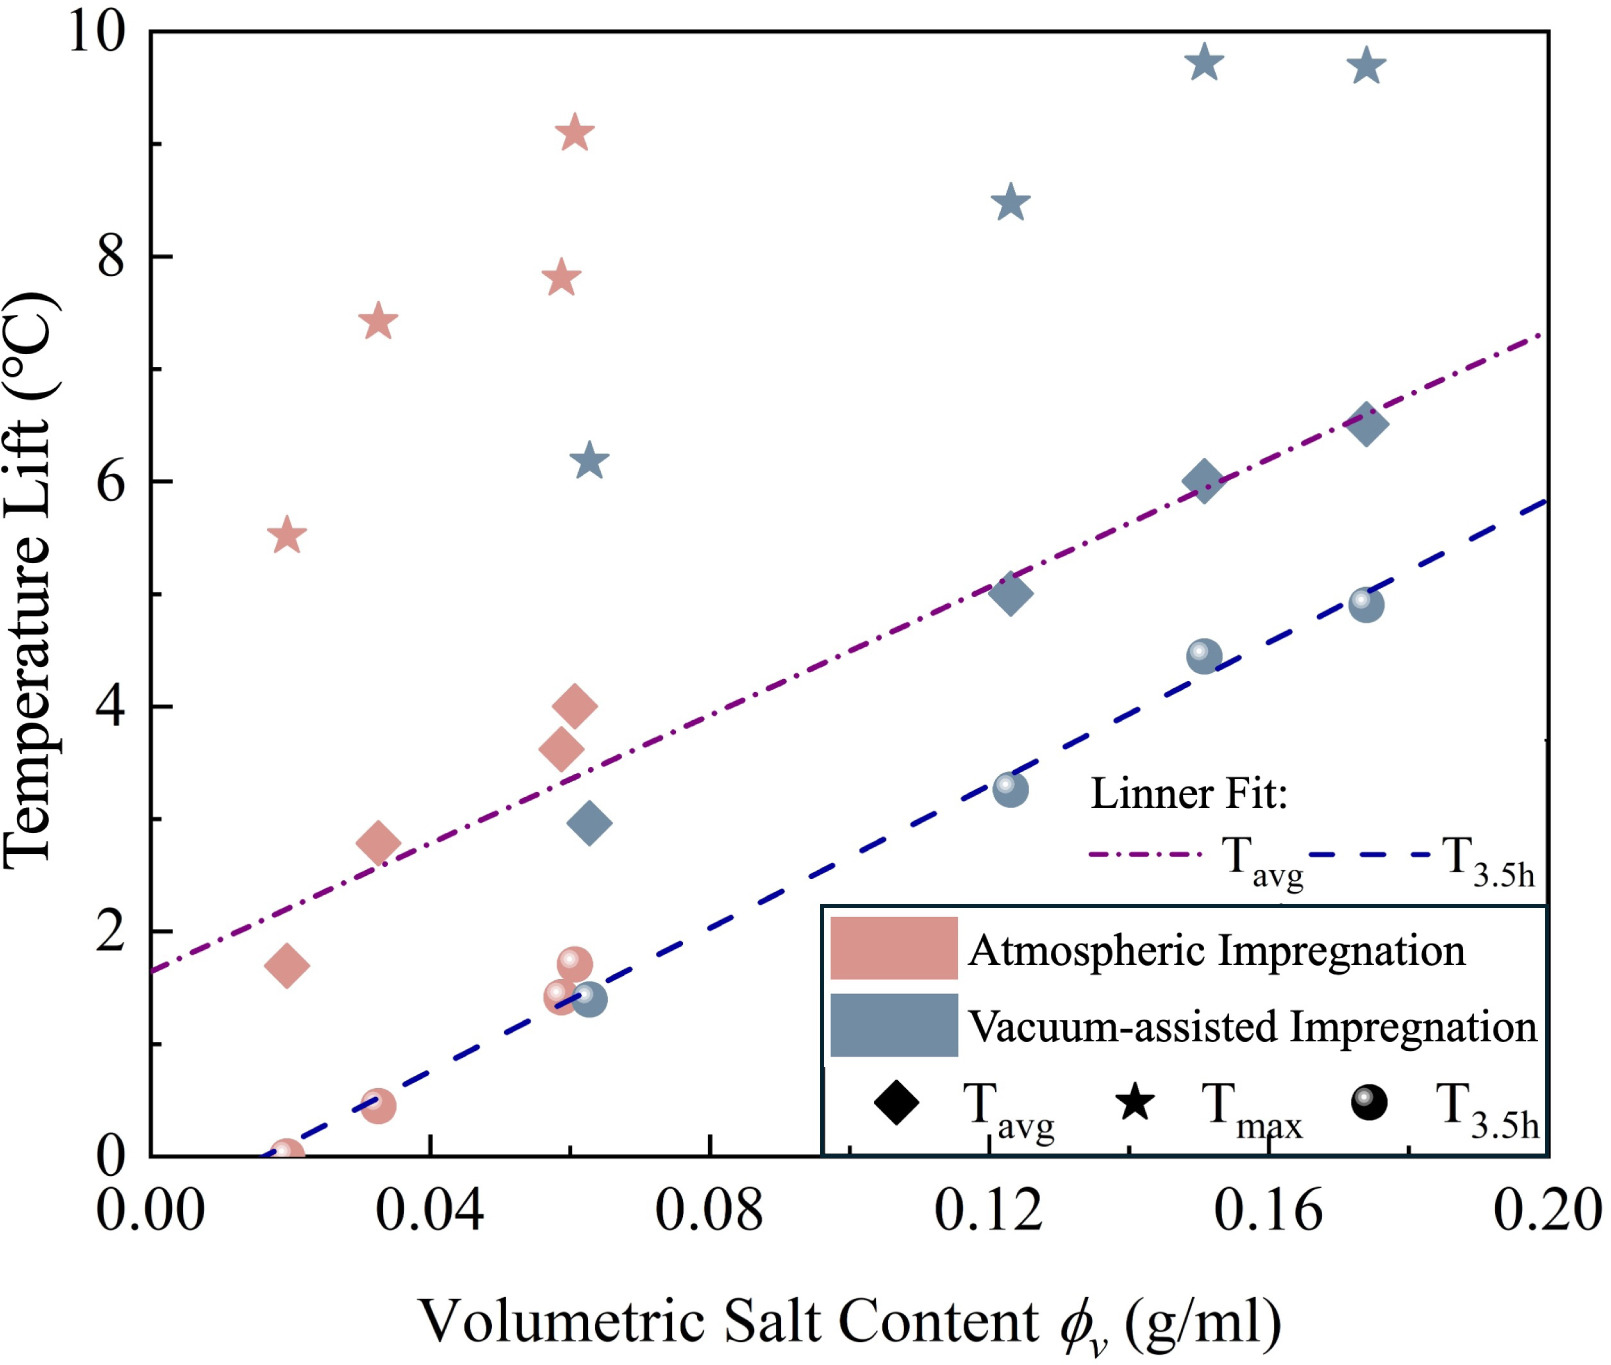
To further investigate the relationship between volumetric salt content and thermal performance, the dynamic performance parameters were plotted against volumetric salt content (), as shown in Fig. 13.
Linear regression analysis confirms the strength of these correlations. For the average temperature rise (), the fitted relationship is described by (). Similarly, the residual temperature rise () exhibits a strong linear dependence on volumetric salt content, following ().
Fig. 13. Relationship between volumetric salt content and dynamic thermal performance parameters.
The experimental results reveal a fundamental relationship between preparation method, volumetric salt content, and thermal performance that reconciles the apparent contradiction between static and dynamic behaviour. While atmospheric-impregnated samples consistently demonstrate faster reaction kinetics in static tests, vacuum-assisted-impregnated samples achieve better thermal output in dynamic experiments due to their higher volumetric salt content.
To isolate the effect of reaction kinetics from salt loading, samples with equivalent volumetric salt content were compared. V-40 A and V-10Vac provide an ideal comparison, both exhibiting comparable volumetric salt contents. Under these normalized conditions, the faster sorption kinetics of atmospheric impregnation translate directly to enhanced thermal performance: V-40 A achieves a significantly higher peak temperature (9.1 °C vs 6.2 °C) and average temperature rise (4.00 °C vs 2.96 °C) compared to V-10Vac. This confirms that reaction kinetics govern heat release intensity when salt availability is equivalent. However, the performance gap narrows over time (sustained : 1.71 vs 1.39 ), and their total water uptake is comparable (81 vs 72 g), indicating that while kinetics dictate the rate of release, the total energy potential is constrained by the similar volumetric capacity.
However, the practical advantage of vacuum-assisted impregnation lies in its capacity to achieve higher volumetric salt content. V-40Vac reaches , approximately 2.6 times higher than V-40 A. This enhanced salt loading compensates for the kinetic penalty, resulting in better overall thermal performance despite slower reaction rates. In practical terms, a reactor filled with V-40Vac could store approximately 2.6 times more heat than one with V-40 A, though it would require roughly 2–3 times longer to deliver that heat under given airflow and humidity conditions.
These competing effects create distinct application niches for each preparation method. For rapid-response applications, atmospheric-impregnated materials prepared from 40 wt% solution (–) are recommended, as lower concentrations yield insufficient volumetric capacity despite fast kinetics. Conversely, for high-capacity or seasonal storage systems where space is limited, vacuum-assisted-impregnated composites prepared from 30–40 wt% solutions (–) are preferred to maximize energy density while maintaining acceptable structural integrity. This analysis demonstrates that while faster kinetics provide better power delivery at equivalent salt loadings, enhanced volumetric capacity can overcome kinetic limitations in space-constrained applications.
4 Conclusions
The relationship between preparation method, volumetric salt content, and sorption performance in vermiculite-CaCl₂ composites was systematically investigated. Detailed microstructural, static, and dynamic characterization yielded the following key findings:
(1) Preparation method controls material architecture and the attainable volumetric salt content. Vacuum-assisted impregnation promotes deeper salt penetration and pore filling, yielding substantially higher than atmospheric impregnation at the same solution concentration.
(2) Volumetric salt content is identified as the primary parameter governing both kinetic and thermal performance. A power-law correlation (, ) relates humidity-corrected reaction rate to volumetric salt content across all samples, indicating that mass transfer resistance increases systematically with salt loading.
(3) Dynamic thermal performance scales directly with volumetric salt content under reactor-scale conditions. All thermal performance indicators (, , ) show strong positive correlations with , confirming that volumetric salt content serves as an effective proxy for energy storage capacity in practical applications.
(4) Material selection requires balancing salt loading and reaction kinetics based on application requirements. The established empirical correlations enable quantitative prediction of performance relationships: atmospheric impregnation with 40 wt% solution (–) optimizes kinetic performance for rapid-response applications, while vacuum-assisted impregnation with 30–40 wt% solutions (–) maximizes volumetric salt content for high-capacity, seasonal storage systems.
These findings establish volumetric salt content as a key design parameter for thermochemical storage composites and provide empirical correlations for material selection and performance prediction. The relationships identified here offer a useful basis for further studies of material behaviour and performance evolution under extended operation.
Nomenclature
Symbol
Description
M_{CaCl₂}
Molar mass of CaCl₂ (110.98 gmol-1)
M_{H₂O}
Molar mass of water (18.01 gmol-1)
Bulk volume of the packed bed (cm3)
Interparticle void volume (cm3)
Normalized uptake at time
Average pressure drop across the packed bed (Pa)
Sustained temperature rise after 3.5 h (°C)
Average temperature rise (°C)
Maximum temperature rise (°C)
Apparent reaction rate constant (h⁻¹)
Humidity-corrected intrinsic rate constant (h⁻¹)
Mass of the sample at time (g)
Initial mass of the sample (g)
Initial dry mass of the sample (g)
Mass of sand filling the voids (g)
Moles of CaCl₂ (mol)
Moles of water (mol)
Time (h)
Time to reach 90% of equilibrium (h)
达到峰值温度的时间 (min)
Pre-exponential factor in Arrhenius equation (h⁻¹)
Activation energy (Jmol⁻¹)
Water vapour partial pressure (Pa)
Equilibrium water vapour pressure (Pa)
Universal gas constant (8.314 Jmol⁻¹ K-1)
Coefficient of determination
Temperature (K or ° C)
Water uptake at time per unit volume (g cm⁻³)
Equilibrium water uptake per unit volume (g cm⁻³)
Instantaneous hydration ratio at time (moles of water per mole of salt)
Greek symbols
Symbol
Description
Power-law coefficient
Power-law exponent
Water uptake during discharge (g)
Temperature rise (°C)
Internal particle porosity (%)
Interparticle void fraction (%)
Gravimetric salt content (%)
Volumetric salt content (g cm⁻³)
Bulk density (g cm⁻³)
Particle density including internal pores (g cm⁻³)
Calibrated bulk density of the fine sand (g cm⁻³)
Skeletal density (g cm⁻³)
Equilibrium hydration ratio (moles of water per mole of salt)
[1] Department for Energy Security and Net Zero — "Energy consumption in the UK 2024", (2024)
[2] D. Gao, B. Zhao, T.H. Kwan, et al. — "The spatial and temporal mismatch phenomenon in solar space heating applications: Status and solutions", Appl Energy 321 (2022) 10.1016/j.apenergy.2022.119326
[3] L. Miró, J. Gasia, L.F. Cabeza — "Thermal energy storage (TES) for industrial waste heat (IWH) recovery: A review", Appl Energy 179 (2016), pp. 284–301 10.1016/j.apenergy.2016.06.147
[4] F. Hao, W. Shao — "What really drives the deployment of renewable energy? A global assessment of 118 countries", Energy Res Soc Sci 72 (2021) 10.1016/j.erss.2020.101880
[5] G. Wang, E. Sbai, L. Wen, et al. — "The impact of renewable energy on extreme volatility in wholesale electricity prices: Evidence from organisation for economic co-operation and development countries", J Clean Prod 484 (2024) 10.1016/j.jclepro.2024.144343
[6] L. Vallese, H. Javadi, B. Badenes, et al. — "A comprehensive review of thermal energy storage technologies and their applications: Creation of a database", Renew Sustain Energy Rev 225 (2026) 10.1016/j.rser.2025.116133
[7] H.J. Xu, X.C. Han, W.S. Hua, et al. — "Progress on thermal storage technologies with high heat density in renewables and low carbon applications: Latent and thermochemical energy storage", Renew Sustain Energy Rev 215 (2025) 10.1016/j.rser.2025.115587
[8] T. Spietz, R. Fryza, J. Lasek, et al. — "Thermochemical energy storage based on salt hydrates: A comprehensive review", Energies 18 (2025), pp. 2643 10.3390/en18102643
[9] W. Li, M. Zeng, Q. Wang — "Development and performance investigation of MgSO4/SrCl2 composite salt hydrate for mid-low temperature thermochemical heat storage", Sol Energy Mater Sol Cells 210 (2020) 10.1016/j.solmat.2020.110509
[10] T. Yang, W. Liu, G.J. Kramer, et al. — "Seasonal thermal energy storage: A techno-economic literature review", Renew Sustain Energy Rev 139 (2021) 10.1016/j.rser.2021.110732
[11] N. Beaupere, A. Malley-Ernewein, T. Nahhas, et al. — "Experimental study of a thermochemical energy storage system operating at low temperature with ettringite-based materials", Sol Energy 282 (2024) 10.1016/j.solener.2024.112927
[12] M. Zbair, S. Bennici — "Survey summary on salts hydrates and composites used in thermochemical sorption heat storage: A review", Energies 14 (2021), pp. 3105 10.3390/en14113105
[13] Wei Li, Jiří Jaromír Klemeš, Qiuwang Wang, et al. — "Salt hydrate–based gas-solid thermochemical energy storage: Current progress, challenges, and perspectives", Renew Sustain Energy Rev 154 (2022) 10.1016/j.rser.2021.111846
[14] M.C. Eberbach, A. Shkatulov, H. Huinink, et al. — "Hydration pathways of CaCl₂ inside matrices with different pore sizes", Microporous Mesoporous Mater 391 (2025) 10.1016/j.micromeso.2025.113605
[15] N. Mazur, M.A. Blijlevens, R. Ruliaman, et al. — "Revisiting salt hydrate selection for domestic heat storage applications", Renew Energy 218 (2023) 10.1016/j.renene.2023.119331
[16] C. Peng, L. Chen, M. Tang — "A database for deliquescence and efflorescence relative humidities of compounds with atmospheric relevance", Fundam Res 2 (2022), pp. 578–587 10.1016/j.fmre.2021.11.021
[17] C. Roßkopf, M. Haas, A. Faik, et al. — "Improving powder bed properties for thermochemical storage by adding nanoparticles", Energy Convers Manage 86 (2014), pp. 93–98 10.1016/j.enconman.2014.05.017
[18] L.G. Gordeeva, Yu.I. Aristov — "Composites ‘salt inside porous matrix’ for adsorption heat transformation: A current state-of-the-art and new trends", Int J Low-Carbon Tech 7 (2012), pp. 288–302 10.1093/ijlct/cts050
[19] X. Zhang, H. Xun, Y. Zhou, et al. — "Research progress on thermochemical adsorption heat storage technology of porous matrix loaded hydrated salt", J Energy Storage 128 (2025) 10.1016/j.est.2025.117040
[20] R. Fisher, Y. Ding, A. Sciacovelli — "Hydration kinetics of K2CO3, MgCl₂ and vermiculite-based composites in view of low-temperature thermochemical energy storage", J Energy Storage 38 (2021) 10.1016/j.est.2021.102561
[21] Y.I. Aristov, M.M. Tokarev, A.D. Grekova, et al. — "Composite sorbents “calcium chloride inside alumina and carbon mesopores” for thermochemical energy storage", AIMS Energy 13 (2025), pp. 901–921 10.3934/energy.2025033
[22] E. Barbosa, A.K. Menon — "Thermochemical energy storage using salt mixtures with improved hydration kinetics and cycling stability", J Energy Storage 90 (2024) 10.1016/j.est.2024.111916
[23] A. Shkatulov, J. Houben, H. Fischer, et al. — "Stabilization of K2CO3 in vermiculite for thermochemical energy storage", Renew Energy 150 (2020), pp. 990–1000 10.1016/j.renene.2019.11.119
[24] H. Yang, C. Wang, Y. Zhang, et al. — "Experimental investigation of a thermochemical energy storage system based on MgSO4-silica gel for building heating: Adsorption/desorption performance testing and system optimization", Energy Convers Manage 301 (2024) 10.1016/j.enconman.2023.118000
[25] Y.-J. Huo, T. Yan, X.-L. Chang, et al. — "Zeolite 13X/MgSO", New J Chem 47 (2023), pp. 18794–18802 10.1039/D3NJ03479H
[26] S.P. Casey, J. Elvins, S. Riffat, et al. — "Salt impregnated desiccant matrices for ‘open’ thermochemical energy storage—Selection, synthesis and characterisation of candidate materials", Energy Build 84 (2014), pp. 412–425 10.1016/j.enbuild.2014.08.028
[27] M. Gaeini, A.L. Rouws, J.W.O. Salari, et al. — "Characterization of microencapsulated and impregnated porous host materials based on calcium chloride for thermochemical energy storage", Appl Energy 212 (2018), pp. 1165–1177 10.1016/j.apenergy.2017.12.131
[28] Z. Chen, Y. Zhang, Y. Zhang, et al. — "A study on vermiculite-based salt mixture composite materials for low-grade thermochemical adsorption heat storage", Energy 278 (2023) 10.1016/j.energy.2023.127986
[29] J. Chen, Y. Zhang, Z. Chen, et al. — "Impact of porous host materials on the compromise of thermochemical energy storage performance", Renew Energy 245 (2025) 10.1016/j.renene.2025.122784
[30] J. Lin, Q. Zhao, H. Huang — "Performance analysis of vermiculite–Potassium carbonate composite materials for efficient thermochemical energy storage", Energies 17 (2024), pp. 2847 10.3390/en17122847
[31] Y. Zhang, Z. Chen, Y. Zhang, et al. — "Parameter control in synthesis of vermiculite-CaCl₂ composite materials for thermochemical adsorption heat storage", Energy 291 (2024) 10.1016/j.energy.2024.130478
[32] L. Wang, Y. Luo, S. Guo, et al. — "Experimental investigation on the thermochemical energy storage performance of MgCl₂-coral aggregate composites", J Energy Storage 116 (2025) 10.1016/j.est.2025.116075
[33] N. Gao, L. Deng, J. Li, et al. — "Multi-form heat storage performance of expanded graphite based CaCl₂ composites for low-grade heat source", Energy Rep 8 (2022), pp. 12117–12125 10.1016/j.egyr.2022.09.051
[34] D. Zou, X. Yue, T. He, et al. — "Experimental research on the preparation of K2CO3/expanded vermiculite composite energy storage material", Materials 15 (2022), pp. 3702 10.3390/ma15103702
[35] J. Reynolds, B. Abbas, G. Sullivan, et al. — "Optimisation of CaCl₂ impregnated expanded graphite and alginate matrices – Targeted salt loading", Energy Convers Manage 302 (2024) 10.1016/j.enconman.2024.118145
[36] H. Wu, S. Wang, D. Zhu — "Effects of impregnating variables on dynamic sorption characteristics and storage properties of composite sorbent for solar heat storage", Sol Energy 81 (2007), pp. 864–871 10.1016/j.solener.2006.11.013
[37] ASTM International — "Standard test method for density and unit weight of soil in place by sand-cone method", (2024) 10.1520/D1556_D1556M-24
[38] A. Wahab, S. Mahiuddin — "Isentropic compressibility and viscosity of aqueous and methanolic calcium chloride solutions", J Chem Eng Data 46 (2001), pp. 1457–1463 10.1021/je010072l
Weekly scan
Check whether a paper is worth your reading time
Clean up one candidate paper before it enters your shortlist, instead of deciding from a messy PDF or publisher page.
Cross-language reading
Read in your preferred language without losing the paper shape
Keep headings, figures, and references aligned instead of flattening everything into a loose chat response.
Review writing
Reuse the same Markdown for notes, summaries, and review drafts
When every paper starts from the same structure, downstream writing gets more predictable and much easier to compare.
Markdown handoff
What you can hand to the next step
The point is not to expose raw internals. The point is to hand over a tidy Markdown handoff.
A structured Markdown file with sections, references, and figure links.
A translated Markdown variant when cross-language reading is needed.
Stable filenames and download artifacts that stay consistent across the site, extension, and API.
Example prompt
A prompt that works on the first try
The parsed Markdown already has enough structure for a lab brief, weekly shortlist note, or comparison memo.
Use this Mdtero Markdown file to write a 200-word reading brief for my lab meeting. Cover the research question, method, strongest evidence, limitations, and whether it belongs in this week's shortlist.